Financial Strength: 2026 National Capability Ratings
Nations on the Global Capability Frontier for Financial Strength
Financial strength is the cornerstone of state power, it's the quiet force that determines whether ambition can be funded, shocks can be absorbed, and dominance can be sustained over time.
Financial Strength covers the state of a nation's macroeconomic foundations, the depth and stability of its financial system, and its capacity to mobilise capital for development.
This research note provides a comprehensive assessment of national capability in financial strength across multiple dimensions. We introduce the domain and its strategic significance, present high-level national assessments using Pareto frontier methodology, and conduct detailed analysis of each of GINC's eight capability groups. The analysis includes five national case studies examining diverse strategic approaches, scenario testing and sensitivity analysis of national assessments, and exploration of data patterns including correlations between capability groups and alignment with published national framework definitions.
Contents
Introduction
Financial Strength is one of nine domains assessed within the National Capability Framework, positioned under the Economic Capability pillar with components covering monetary/currency stability, sovereign credit, growth trends, financial market development, international financial linkages, sovereign wealth, regulatory quality in finance, and capital availability. Together, in creating a country's Financial Strength, these metrics indicate the extent to which a nation’s economy is resilient to shocks, trusted by investors, and capable of financing both public and private sector needs.
Figure 1. Top 25 Nations: Financial Strength Capability Frontier
| Financial Strength | Hard Capability | Soft Capability | Econ Capability | Frontiers | |||||||||
|---|---|---|---|---|---|---|---|---|---|---|---|---|---|
| Tier | Nation | CT | SI | NS | HC | II | GI | FS | PI | TI | T1 | T2 | T3 |
| T1 | 🇫🇷 France | T3 | T2 | T2 | T4 | T2 | T5 | T1 | T3 | T3 | 1 | 3 | 3 |
| T1 | 🇩🇪 Germany | T2 | T2 | T4 | T4 | T1 | T4 | T1 | T3 | T3 | 2 | 2 | 2 |
| T1 | 🇸🇬 Singapore | T4 | T1 | T4 | T1 | T1 | T1 | T1 | T1 | T1 | 7 | - | - |
| T1 | 🇸🇪 Sweden | T2 | T1 | T4 | T2 | T1 | T1 | T1 | T1 | T2 | 5 | 3 | - |
| T1 | 🇬🇧 United Kingdom | T4 | T3 | T3 | T4 | T2 | T4 | T1 | T4 | T4 | 1 | 1 | 2 |
| T1 | 🇺🇸 United States | T1 | T1 | T1 | T1 | T1 | T3 | T1 | T1 | T1 | 8 | - | 1 |
| T2 | 🇩🇰 Denmark | T5 | T2 | T5 | T2 | T1 | T1 | T2 | T2 | T2 | 2 | 5 | - |
| T2 | 🇯🇵 Japan | T3 | T1 | T3 | T4 | T1 | T3 | T2 | T2 | T2 | 2 | 3 | 3 |
| T2 | 🇳🇱 Netherlands | T2 | T1 | T4 | T3 | T1 | T2 | T2 | T2 | T2 | 2 | 5 | 1 |
| T2 | 🇳🇴 Norway | T4 | T1 | T4 | T3 | T1 | T1 | T2 | T3 | T3 | 3 | 1 | 3 |
| T2 | 🇰🇷 South Korea | T2 | T1 | T3 | T2 | T1 | T2 | T2 | T1 | T1 | 4 | 4 | 1 |
| T2 | 🇨🇭 Switzerland | T2 | T1 | T5 | T1 | T1 | T1 | T2 | T1 | T1 | 6 | 2 | - |
| T2 | 🇦🇪 UAE | T5 | T1 | T4 | T4 | T1 | T2 | T2 | T2 | T2 | 2 | 4 | - |
| T3 | 🇦🇺 Australia | T5 | T3 | T4 | T4 | T2 | T3 | T3 | T4 | T4 | - | 1 | 3 |
| T3 | 🇨🇦 Canada | T5 | T3 | T5 | T4 | T3 | T3 | T3 | T3 | T4 | - | - | 5 |
| T3 | 🇨🇳 China | T2 | T1 | T2 | T3 | T2 | T4 | T3 | T2 | T2 | 1 | 5 | 2 |
| T3 | 🇪🇪 Estonia | T7 | T3 | T5 | T1 | T2 | T1 | T3 | T2 | T1 | 3 | 2 | 2 |
| T3 | 🇫🇮 Finland | T4 | T1 | T5 | T2 | T1 | T1 | T3 | T2 | T3 | 3 | 2 | 2 |
| T3 | 🇮🇱 Israel | T2 | T2 | T1 | T1 | T2 | T1 | T3 | T1 | T1 | 5 | 3 | 1 |
| T3 | 🇶🇦 Qatar | T7 | T2 | T5 | T5 | T3 | T4 | T3 | T7 | T6 | - | 1 | 2 |
| T3 | 🇸🇦 Saudi Arabia | T6 | T2 | T4 | T5 | T3 | T6 | T3 | T5 | T5 | - | 1 | 2 |
| T4 | 🇦🇹 Austria | T5 | T3 | T6 | T3 | T3 | T4 | T4 | T4 | T4 | - | - | 3 |
| T4 | 🇧🇪 Belgium | T5 | T3 | T5 | T5 | T4 | T5 | T4 | T3 | T4 | - | - | 2 |
| T4 | 🇮🇪 Ireland | T5 | T3 | T8 | T5 | T2 | T4 | T4 | T3 | T3 | - | 1 | 3 |
| T4 | 🇱🇺 Luxembourg | T7 | T3 | T7 | T4 | T2 | T3 | T4 | T4 | T5 | - | 1 | 2 |
| T4 | 🇲🇾 Malaysia | T9 | T4 | T6 | T7 | T6 | T9 | T4 | T6 | T7 | - | - | - |
| T4 | 🇳🇿 New Zealand | T7 | T4 | T6 | T5 | T3 | T2 | T4 | T5 | T5 | - | 1 | 1 |
| T4 | 🇹🇼 Taiwan | T6 | T4 | T5 | T5 | T3 | T4 | T4 | T2 | T2 | - | 2 | 1 |
Figure 1. Critical Capability Domain Overview
| Capability | Top 5 | Description |
|---|---|---|
| Capital Availability and Access | ||
| Financial inclusion | 🇪🇪 🇸🇪 🇸🇬 🇦🇪 🇳🇴 | Access to banking and financial services |
| Infrastructure and SME finance | 🇸🇬 🇸🇪 🇩🇰 🇦🇪 🇨🇭 | Lending for infrastructure and small business |
| Private sector credit | 🇸🇬 🇺🇸 🇩🇰 🇸🇪 🇮🇱 | Credit availability to businesses and individuals |
| Financial Governance and Regulation | ||
| Global standards compliance | 🇸🇬 🇨🇭 🇺🇸 🇬🇧 🇳🇴 | Adherence to international regulatory frameworks |
| Prudential oversight | 🇸🇬 🇨🇭 🇸🇪 🇳🇱 🇦🇺 | Banking supervision and risk management |
| Regulatory independence | 🇸🇬 🇸🇪 🇩🇰 🇨🇭 🇳🇱 | Autonomous financial regulatory institutions |
| Financial Markets Depth | ||
| Banking sector assets | 🇸🇬 🇺🇸 🇨🇭 🇦🇪 🇰🇷 | Scale and capacity of banking system |
| Equity and bond markets | 🇺🇸 🇸🇬 🇨🇭 🇬🇧 🇸🇪 | Capital markets size and sophistication |
| Market liquidity | 🇩🇯 🇺🇸 🇸🇬 🇨🇭 🇪🇹 | Ease of trading and transaction execution |
| Fiscal Strength | ||
| Debt sustainability | 🇳🇴 🇸🇬 🇸🇪 🇺🇸 🇨🇭 | Government debt levels and fiscal capacity |
| Fiscal balance | 🇸🇬 🇳🇴 🇸🇪 🇨🇭 🇩🇰 | Budget surplus or deficit position |
| Sovereign credit quality | 🇺🇸 🇸🇬 🇨🇭 🇳🇴 🇸🇪 | Government creditworthiness and ratings |
| Global Financial Integration | ||
| Cross-border capital flows | 🇸🇬 🇺🇸 🇨🇭 🇦🇪 🇱🇺 | International investment and capital mobility |
| Global institution participation | 🇺🇸 🇬🇧 🇸🇬 🇩🇪 🇨🇭 | Engagement in international financial bodies |
| Reserve currency role | 🇺🇸 🇩🇪 🇫🇷 🇪🇸 🇧🇪 | Currency held in global foreign exchange reserves |
| Monetary and Currency Stability | ||
| Central bank independence | 🇨🇭 🇸🇬 🇳🇴 🇺🇸 🇸🇪 | Autonomous monetary policy institutions |
| Exchange rate stability | 🇸🇬 🇺🇸 🇨🇭 🇳🇴 🇰🇷 | Currency value consistency and predictability |
| Inflation control | 🇸🇪 🇸🇬 🇨🇭 🇩🇰 🇳🇴 | Price stability and monetary management |
| Resilience and Shock Absorption | ||
| Banking stability | 🇸🇬 🇨🇭 🇸🇪 🇮🇱 🇳🇴 | Financial system robustness and resilience |
| Crisis response mechanisms | 🇸🇬 🇰🇷 🇳🇱 🇸🇪 🇮🇱 | Emergency financial stabilisation capacity |
| Financial safeguards and external buffers | 🇳🇴 🇸🇬 🇦🇪 🇶🇦 🇨🇭 | Reserves and protective financial mechanisms |
| Sovereign Wealth and Reserve Capacity | ||
| External investment reach | 🇺🇸 🇸🇬 🇦🇪 🇨🇳 🇸🇪 | Global investment portfolio and influence |
| Foreign exchange reserves | 🇸🇬 🇨🇭 🇦🇪 🇰🇷 🇨🇳 | International currency holdings and buffers |
| Sovereign wealth funds | 🇸🇬 🇳🇴 🇦🇪 🇸🇦 🇶🇦 | State-owned investment vehicles and assets |
Emerging National Assessments
GINC’s emerging national assessments use synthetic expert simulations to evaluate each nation across individual capabilities. For every capability, nations are assessed against a structured rubric ranging from No Plans (NP), indicating no current intention to develop the capability, through to AAA, representing performance at the global frontier.
Capability Groups, such as Financial Markets Depth & Liquidity, aggregate the underlying capability ratings to represent the group’s overall capability level. Within the Financial Strength domain, these groups, listed in figure 1, comprise of 3 individual capabilities.
At the domain level, GINC expresses national capability in Financial Strength using the Pareto frontier, which evaluates nations based on whether they dominate, or are dominated by other nations across all underlying capabilities. Rather than weighting indices such as Capability Groups, the Pareto approach places countries into peer groups, or Tiers, according to their relative position and distance from the capability frontier.
It is important to understand not just whether domination occurs, but also how domination is formed. This is seen in the capability profiles of nations, understanding the shape of competitive advantage.
Through this Pareto domination analysis, it is identified that France, Germany, Singapore, Sweden, the UK, and the US are operating on the frontier, with nations like the UAE and Norway a tier below.
Figure 2. Financial Strength Capability Tiers
| COUNTRY | PROFILE | STRENGTHS | WEAKNESSES |
|---|---|---|---|
| Tier 1 Frontier Nations | |||
| 🇩🇪 Germany | Asymmetric | ||
| 🇫🇷 France | Asymmetric | ||
| 🇬🇧 United Kingdom | Asymmetric | ||
| 🇸🇪 Sweden | Asymmetric | ||
| 🇺🇸 United States | Asymmetric | ||
| 🇸🇬 Singapore | Specialised | ||
| Tier 2 Nations | |||
| 🇦🇪 United Arab Emirates | Asymmetric | ||
| 🇩🇰 Denmark | Asymmetric | ||
| 🇰🇷 South Korea | Asymmetric | ||
| 🇨🇭 Switzerland | Specialised | ||
| 🇯🇵 Japan | Specialised | ||
| 🇳🇱 Netherlands | Specialised | ||
| 🇳🇴 Norway | Specialised | ||
| Tier 3 Nations | |||
| 🇦🇺 Australia | Asymmetric | ||
| 🇨🇦 Canada | Asymmetric | ||
| 🇨🇳 China | Asymmetric | ||
| 🇪🇸 Spain | Asymmetric | ||
| 🇫🇮 Finland | Asymmetric | ||
| 🇮🇱 Israel | Asymmetric | ||
| 🇶🇦 Qatar | Asymmetric | ||
| 🇸🇦 Saudi Arabia | Asymmetric | ||
| 🇪🇪 Estonia | Specialised | ||
| Tier 4 Nations | |||
| 🇦🇹 Austria | Asymmetric | ||
| 🇧🇪 Belgium | Asymmetric | ||
| 🇭🇰 Hong Kong | Asymmetric | ||
| 🇮🇪 Ireland | Asymmetric | ||
| 🇳🇿 New Zealand | Asymmetric | ||
| 🇱🇺 Luxembourg | Specialised | ||
| 🇲🇾 Malaysia | Specialised | ||
| 🇹🇼 Taiwan | Specialised | ||
Further Pareto frontier analysis in a capability domination matrix seen in Figure 3 outlines the patterns of capability dominance among nations.
To read the matrix: each cell shows how many capability groups the column country dominates the row country in. Dominance occurs when the column country scores strictly greater than (not equal to) the row country in a given capability group. For example, if the United States (column) and Germany (row) shows a value of 8, this indicates that the US outperforms Germany in 8 of the underlying capability groups. As countries can not dominate themselves, some cells are marked with "-".
Figure 3. Capability Domination Matrix: Cross-National Performance Comparison
[table here]
Capability Groups
Financial Strength is one of nine domains in the National Capability Framework, comprising 24 underlying capabilities organised into 8 capability groups. GINC's framework provides a standardised taxonomy that enables systematic cross-national comparison of Financial Strength. Figure X presents the top five nations in each capability group, ranked by their average capability score.
Figure 4. Top 5 Nations by Group (countries are wrong)
| Capability Group | #1 | #2 | #3 | #4 | #5 |
|---|---|---|---|---|---|
| Monetary/Currency Stability |
🇸🇬 SG · 15.7 |
🇨🇭 CH · 15.3 |
🇳🇴 NO · 15.0 |
🇺🇸 US · 15.0 |
🇰🇷 KR · 14.7 |
| Capital Availability Access |
🇸🇪 SE · 16.3 |
🇸🇬 SG · 16.0 |
🇩🇰 DK · 15.7 |
🇦🇪 AE · 15.7 |
🇮🇱 IL · 15.3 |
| Financial Governance & Regulation |
🇸🇬 SG · 16.7 |
🇨🇭 CH · 15.7 |
🇸🇪 SE · 15.3 |
🇬🇧 GB · 15.3 |
🇳🇴 NO · 15.0 |
| Fiscal Strength & Sovereign Creditworthiness |
🇸🇬 SG · 16.0 |
🇨🇭 CH · 16.0 |
🇳🇴 NO · 16.0 |
🇸🇪 SE · 15.7 |
🇺🇸 US · 15.3 |
| Global Financial Integration |
🇺🇸 US · 17.0 |
🇫🇷 FR · 15.0 |
🇩🇪 DE · 15.0 |
🇬🇧 GB · 14.3 |
🇪🇸 ES · 14.0 |
| Resilience & Shock Absorption |
🇸🇬 SG · 16.3 |
🇳🇴 NO · 16.0 |
🇨🇭 CH · 15.7 |
🇸🇪 SE · 15.3 |
🇰🇷 KR · 15.0 |
| Financial Markets Depth & Liquidity |
🇺🇸 US · 16.3 |
🇸🇬 SG · 16.0 |
🇨🇭 CH · 15.3 |
🇸🇪 SE · 15.3 |
🇰🇷 KR · 15.0 |
Fiscal Strength & Sovereign Creditworthiness shows tight clustering between 15-16 points. In Capital Availability Access, Singapore trails Sweden closely, with Denmark, the UAE, and Israel close behind. The US leads Financial Markets Depth & Liquidity tightly, with Singapore 0.3 points behind, followed by Switzerland, Sweden, and South Korea. The US dominates Global Financial Integration. In Financial Governance & Regulation Singapore holds a 1pt differential to Switzerland with Sweden, the UK, and Norway tightly grouped.
As previously mentioned, through examining capability group patterns across the 15 nations in Tiers 1, 2, and 3 each nation's relative strengths and weaknesses can be revealed. This analysis illustrates the three capability profiles, Balanced, Asymmetric, and Specialised, introduced in Figure 2, demonstrating the multi-dimension nature of Pareto domination.
Figure 5. Capability Group Profiles of the Top 3 Tiers
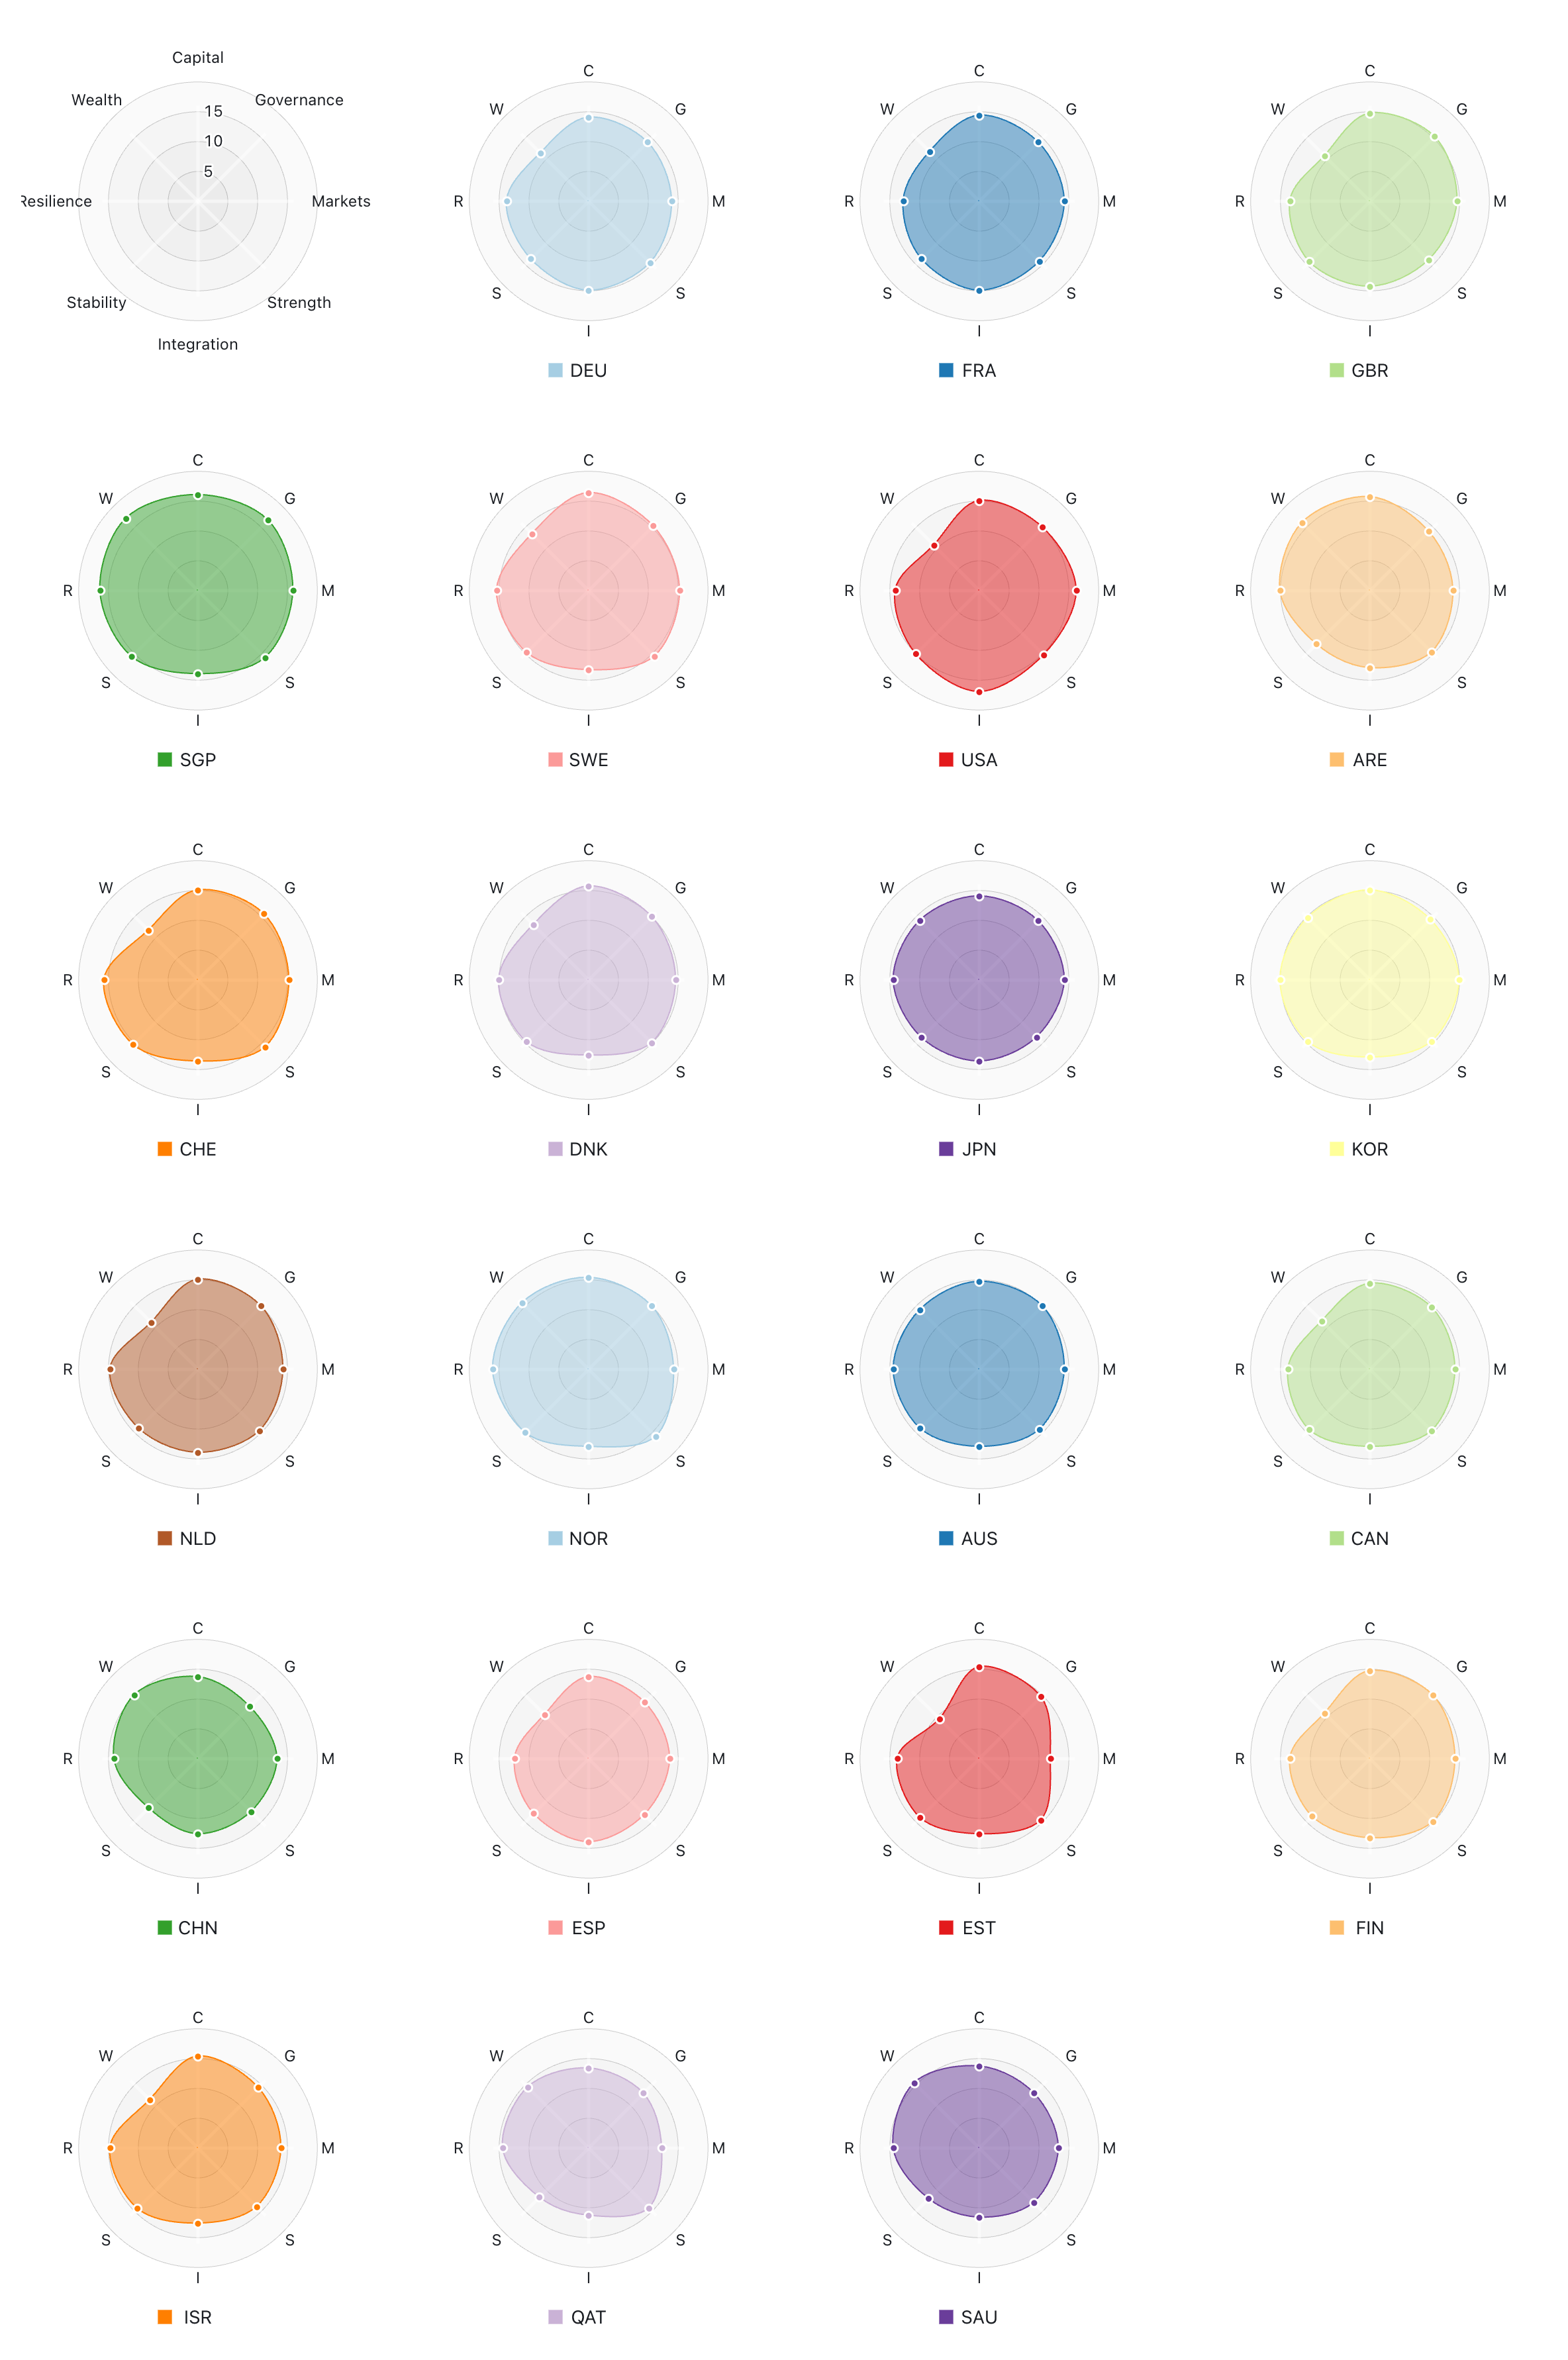
Through radar charts in Figure 5, the clear trend is a common weakness in the Sovereign Wealth Capacity, less Norway, Singapore, Saudi Arabia, and the UAE to name a few. However, Notably the US fills a common weakness in Global Financial Integration, with Germany and France close behind.
Figure X provides a broader view across all 200 assessed nations. Each vertical line represents one nation's capability group performance, with red lines marking the bottom quartile, median, and top quartile thresholds.
Figure X. Global Capability Group Distribution
[comment]