Critical Technology: 2026 National Capability Ratings
How advanced technologies shape power, prosperity, and resilience, have driven the rise and decline of nations, and define the current leaders in critical technology

- GINC assesses 200+ nations across 63 critical technology capabilities organized into eight groups, using Pareto frontier methodology to rank countries into competitive tiers rather than simple weighted indices.
- The US leads all eight capability groups, with particularly strong advantages in AI, Biotech & Genetics, and Position, Navigation & Timing, while China follows closely in Advanced Materials and Energy Technology.
- Nations display three capability profiles: Balanced (even performance), Specialised (concentrated excellence), and Asymmetric (irregular patterns), revealing how countries achieve their competitive tier through different strategic approaches to technology development.
From industrialisation to the digital age, the rise and decline of nations has been repeatedly shaped by their ability to develop, scale, and control critical technologies.
Critical Technology comprises the advanced, high-impact technological capabilities that underpin a nation’s power, prosperity, and resilience, shaping its military and strategic advantage, economic competitiveness and growth, and capacity to withstand, adapt to, and recover from systemic shocks, while determining its freedom of action and vulnerability in an increasingly contested global environment.
This research note provides a comprehensive assessment of national capability in critical technology across multiple dimensions. We introduce the domain and its strategic significance, present high-level national assessments using Pareto frontier methodology, and conduct detailed analysis of each of GINC's eight capability groups. The analysis includes five national case studies examining diverse strategic approaches, scenario testing and sensitivity analysis of national assessments, and exploration of data patterns including correlations between capability groups and alignment with published national framework definitions.
Contents
Introduction
National Assessments
Capability Groups
National Case Studies
Scenarios and Sensitivity Analysis
Data and Definitions
Introduction
Critical Technology is one of nine domains assessed within the National Capability Framework and one of three domains that comprise the Hard Power pillar. It aggregates 63 underlying capabilities, organised into eight capability groups, which together define a nation’s critical technology capacity. GINC's Critical Technology framework provides a standardized taxonomy that maps to published national definitions, enabling systematic comparison of technological capabilities across diverse strategic approaches and policy frameworks.
Figure 1. Top 25 Nations: Critical Technology Capability Frontier
| Critical Technology | Hard Capability | Soft Capability | Econ Capability | Frontiers | |||||||||
|---|---|---|---|---|---|---|---|---|---|---|---|---|---|
| Tier | Nation | CT | SI | NS | HC | II | GI | FS | PI | TI | T1 | T2 | T3 |
| T1 | 🇺🇸 United States | T1 | T1 | T1 | T1 | T1 | T3 | T1 | T1 | T1 | 8 | - | 1 |
| T2 | 🇨🇳 China | T2 | T1 | T2 | T3 | T2 | T4 | T3 | T2 | T2 | 1 | 5 | 2 |
| T2 | 🇩🇪 Germany | T2 | T2 | T4 | T4 | T1 | T4 | T1 | T3 | T3 | 2 | 2 | 2 |
| T2 | 🇮🇱 Israel | T2 | T2 | T1 | T1 | T2 | T1 | T3 | T1 | T1 | 5 | 3 | 1 |
| T2 | 🇳🇱 Netherlands | T2 | T1 | T4 | T3 | T1 | T2 | T2 | T2 | T2 | 2 | 5 | 1 |
| T2 | 🇰🇷 South Korea | T2 | T1 | T3 | T2 | T1 | T2 | T2 | T1 | T1 | 4 | 4 | 1 |
| T2 | 🇸🇪 Sweden | T2 | T1 | T4 | T2 | T1 | T1 | T1 | T1 | T2 | 5 | 3 | - |
| T2 | 🇨🇭 Switzerland | T2 | T1 | T5 | T1 | T1 | T1 | T2 | T1 | T1 | 6 | 2 | - |
| T3 | 🇫🇷 France | T3 | T2 | T2 | T4 | T2 | T5 | T1 | T3 | T3 | 1 | 3 | 3 |
| T3 | 🇯🇵 Japan | T3 | T1 | T3 | T4 | T1 | T3 | T2 | T2 | T2 | 2 | 3 | 3 |
| T4 | 🇫🇮 Finland | T4 | T1 | T5 | T2 | T1 | T1 | T3 | T2 | T3 | 3 | 2 | 2 |
| T4 | 🇳🇴 Norway | T4 | T1 | T4 | T3 | T1 | T1 | T2 | T3 | T3 | 3 | 1 | 3 |
| T4 | 🇸🇬 Singapore | T4 | T1 | T4 | T1 | T1 | T1 | T1 | T1 | T1 | 7 | - | - |
| T4 | 🇬🇧 United Kingdom | T4 | T3 | T3 | T4 | T2 | T4 | T1 | T4 | T4 | 1 | 1 | 2 |
| T5 | 🇦🇺 Australia | T5 | T3 | T4 | T4 | T2 | T3 | T3 | T4 | T4 | - | 1 | 3 |
| T5 | 🇦🇹 Austria | T5 | T3 | T6 | T3 | T3 | T4 | T4 | T4 | T4 | - | - | 3 |
| T5 | 🇧🇪 Belgium | T5 | T3 | T5 | T5 | T4 | T5 | T4 | T3 | T4 | - | - | 2 |
| T5 | 🇨🇦 Canada | T5 | T3 | T5 | T4 | T3 | T3 | T3 | T3 | T4 | - | - | 5 |
| T5 | 🇩🇰 Denmark | T5 | T2 | T5 | T2 | T1 | T1 | T2 | T2 | T2 | 2 | 5 | - |
| T5 | 🇮🇪 Ireland | T5 | T3 | T8 | T5 | T2 | T4 | T4 | T3 | T3 | - | 1 | 3 |
| T5 | 🇮🇹 Italy | T5 | T4 | T3 | T7 | T4 | T7 | T5 | T6 | T5 | - | - | 1 |
| T5 | 🇷🇺 Russia | T5 | T3 | T3 | T8 | T6 | T10 | T10 | T12 | T11 | - | - | 2 |
| T5 | 🇪🇸 Spain | T5 | T3 | T4 | T6 | T3 | T6 | T3 | T5 | T5 | - | - | 3 |
| T5 | 🇦🇪 UAE | T5 | T1 | T4 | T4 | T1 | T2 | T2 | T2 | T2 | 2 | 4 | - |
Figure 1. Critical Capability Domain Overview
| Capability | Top 5 | Description |
|---|---|---|
| Advanced Materials | ||
| Additive manufacturing | 🇺🇸 🇩🇪 🇸🇪 🇨🇳 🇨🇭 | 3D printing and advanced manufacturing techniques |
| Advanced coatings | 🇺🇸 🇯🇵 🇮🇱 🇳🇱 🇰🇷 | Protective and functional surface treatments |
| Advanced composite materials | 🇺🇸 🇯🇵 🇫🇷 🇨🇳 🇮🇱 | High-performance structural materials |
| Advanced explosives and energetic materials | 🇺🇸 🇨🇳 🇮🇱 🇷🇺 🇫🇷 | High-energy materials for propulsion and munitions |
| Advanced magnets and superconductors | 🇺🇸 🇯🇵 🇨🇳 🇩🇪 🇨🇭 | High-field magnets and zero-resistance materials |
| Advanced protection | 🇺🇸 🇮🇱 🇰🇷 🇩🇪 🇬🇧 | Armour and defensive materials |
| Continuous flow chemical synthesis | 🇺🇸 🇨🇭 🇩🇪 🇳🇱 🇨🇳 | Advanced chemical production processes |
| Critical minerals extraction and processing | 🇨🇳 🇨🇱 🇫🇮 🇳🇴 🇦🇺 | Rare earth and strategic mineral production |
| High-specification machining processes | 🇨🇭 🇯🇵 🇩🇪 🇺🇸 🇸🇬 | Precision manufacturing and fabrication |
| Nanoscale materials and manufacturing | 🇺🇸 🇳🇱 🇰🇷 🇨🇳 🇩🇪 | Nanotechnology and molecular-scale engineering |
| Novel metamaterials | 🇺🇸 🇨🇳 🇫🇷 🇰🇷 🇯🇵 | Engineered materials with unique properties |
| Smart materials | 🇺🇸 🇨🇭 🇰🇷 🇨🇳 🇯🇵 | Responsive and adaptive materials |
| Wide and ultrawide bandgap semiconductors | 🇺🇸 🇯🇵 🇩🇪 🇨🇳 🇫🇷 | Next-generation power and RF electronics |
| Artificial Intelligence | ||
| Advanced data analytics | 🇺🇸 🇮🇱 🇨🇳 🇸🇪 🇨🇭 | Large-scale data processing and insights |
| Advanced integrated circuit design and fabrication | 🇰🇷 🇹🇼 🇺🇸 🇯🇵 🇸🇬 | Advanced chip design and semiconductor manufacturing |
| Adversarial AI | 🇺🇸 🇨🇳 🇮🇱 🇰🇷 🇨🇭 | AI security and robustness testing |
| AI algorithms and hardware accelerators | 🇺🇸 🇮🇱 🇰🇷 🇨🇳 🇬🇧 | Specialised AI processing systems |
| Machine learning | 🇺🇸 🇨🇳 🇮🇱 🇨🇭 🇰🇷 | Statistical learning and pattern recognition |
| Natural language processing | 🇺🇸 🇨🇳 🇮🇱 🇸🇬 🇳🇱 | Language understanding and generation systems |
| Advanced ICT | ||
| Advanced optical communication | 🇺🇸 🇨🇳 🇸🇬 🇳🇱 🇰🇷 | Fibre-optic and photonic communications |
| Advanced radiofrequency communication | 🇺🇸 🇸🇪 🇮🇱 🇰🇷 🇨🇳 | RF spectrum and wireless technologies |
| Advanced undersea wireless communication | 🇨🇳 🇺🇸 🇯🇵 🇳🇴 🇫🇷 | Submarine and underwater communications |
| Distributed ledgers | 🇨🇳 🇸🇬 🇺🇸 🇨🇭 🇮🇱 | Blockchain and decentralised systems |
| High-performance computing | 🇺🇸 🇨🇳 🇫🇮 🇯🇵 🇩🇪 | Supercomputing and large-scale computation |
| Mesh and infrastructure-independent networks | 🇮🇱 🇨🇳 🇺🇸 🇫🇮 🇸🇪 | Resilient ad hoc networking |
| Protective cybersecurity technologies | 🇮🇱 🇪🇪 🇺🇸 🇳🇱 🇨🇳 | Network defence and critical infrastructure protection |
| Biotechnology and Genetics | ||
| Biological manufacturing | 🇺🇸 🇨🇭 🇩🇪 🇨🇳 🇰🇷 | Bioproduction and industrial biotechnology |
| Genetic engineering | 🇺🇸 🇨🇳 🇨🇭 🇫🇷 🇯🇵 | Gene editing and modification technologies |
| Genomic sequencing and analysis | 🇺🇸 🇨🇳 🇬🇧 🇨🇭 🇩🇪 | DNA/RNA sequencing and computational genomics |
| Novel antibiotics and antivirals | 🇨🇭 🇳🇱 🇺🇸 🇸🇪 🇮🇱 | Next-generation antimicrobial therapeutics |
| Nuclear medicine and radiation therapy | 🇺🇸 🇰🇷 🇨🇳 🇨🇭 🇫🇷 | Medical isotopes and radiotherapy |
| Synthetic biology | 🇺🇸 🇨🇳 🇬🇧 🇨🇭 🇳🇱 | Engineered biological systems and organisms |
| Vaccines and medical countermeasures | 🇺🇸 🇨🇭 🇩🇪 🇨🇳 🇰🇷 | Immunological protection and pandemic response |
| Energy Technology | ||
| Biofuels | 🇧🇷 🇫🇮 🇸🇪 🇳🇱 🇺🇸 | Renewable biological energy sources |
| Directed energy technologies | 🇺🇸 🇨🇳 🇮🇱 🇫🇷 🇰🇷 | Laser and high-power microwave systems |
| Electric batteries | 🇨🇳 🇰🇷 🇺🇸 🇸🇪 🇯🇵 | Energy storage and power systems |
| Electronic warfare | 🇺🇸 🇮🇱 🇨🇳 🇰🇷 🇫🇷 | Electromagnetic spectrum operations |
| Hydrogen and ammonia for power | 🇯🇵 🇺🇸 🇩🇰 🇳🇱 🇳🇴 | Alternative energy carriers and fuel cells |
| Nuclear energy | 🇨🇳 🇷🇺 🇰🇷 🇺🇸 🇫🇷 | Fission reactors and advanced nuclear systems |
| Nuclear waste management and recycling | 🇫🇷 🇫🇮 🇷🇺 🇸🇪 🇯🇵 | Spent fuel processing and disposal |
| Photovoltaics | 🇨🇳 🇨🇱 🇺🇸 🇩🇪 🇦🇪 | Solar cell technology and conversion |
| Supercapacitors | 🇨🇳 🇺🇸 🇯🇵 🇰🇷 🇩🇪 | High-power energy storage devices |
| Position, Navigation and Timing | ||
| Atomic clocks | 🇺🇸 🇯🇵 🇩🇪 🇨🇳 🇫🇷 | Precision timekeeping systems |
| Gravitational force sensors | 🇺🇸 🇨🇳 🇨🇭 🇩🇪 🇯🇵 | Gravity-based navigation and detection |
| Inertial navigation systems | 🇺🇸 🇨🇳 🇯🇵 🇫🇷 🇮🇱 | Self-contained positioning technology |
| Magnetic field sensors | 🇺🇸 🇨🇳 🇮🇱 🇯🇵 🇩🇪 | Magnetometry and anomaly detection |
| Multispectral and hyperspectral imaging sensors | 🇺🇸 🇮🇱 🇨🇳 🇨🇭 🇯🇵 | Advanced spectral imaging systems |
| Photonic sensors | 🇺🇸 🇨🇭 🇮🇱 🇫🇷 🇯🇵 | Light-based sensing technologies |
| Radar | 🇺🇸 🇨🇳 🇮🇱 🇸🇪 🇯🇵 | Radio detection and ranging systems |
| Sonar and acoustic sensors | 🇺🇸 🇬🇧 🇨🇳 🇰🇷 🇯🇵 | Underwater and acoustic detection |
| Quantum Computing | ||
| Post-quantum cryptography | 🇺🇸 🇮🇱 🇨🇳 🇨🇭 🇳🇱 | Quantum-resistant encryption systems |
| Quantum communication | 🇨🇳 🇨🇭 🇺🇸 🇯🇵 🇫🇷 | Quantum key distribution and secure communications |
| Quantum computing (general) | 🇺🇸 🇨🇳 🇳🇱 🇮🇱 🇬🇧 | Quantum processors and algorithms |
| Quantum sensors | 🇺🇸 🇩🇪 🇨🇳 🇯🇵 🇳🇱 | Quantum-enhanced measurement devices |
| Space, Robotics and Mobility | ||
| Advanced aircraft engines | 🇺🇸 🇨🇱 🇫🇷 🇨🇳 🇷🇺 | High-performance propulsion systems |
| Advanced robotics | 🇺🇸 🇰🇷 🇮🇱 🇸🇬 🇨🇳 | Autonomous manipulation and industrial robots |
| Air-independent propulsion | 🇩🇪 🇸🇪 🇨🇳 🇮🇹 🇯🇵 | Non-nuclear submarine propulsion |
| Autonomous systems operation technologies | 🇺🇸 🇮🇱 🇨🇳 🇳🇱 🇸🇬 | Self-operating platforms and vehicles |
| Autonomous underwater vehicles | 🇺🇸 🇳🇴 🇯🇵 🇫🇷 🇨🇳 | Unmanned subsea platforms |
| Drones, swarming and collaborative robots | 🇺🇸 🇮🇱 🇨🇳 🇰🇷 🇸🇬 | Coordinated unmanned systems |
| Hypersonic detection and tracking | 🇺🇸 🇨🇳 🇫🇷 🇨🇱 🇯🇵 | Systems to detect Mach 5+ threats |
| Small satellites | 🇺🇸 🇨🇳 🇮🇱 🇯🇵 🇳🇱 | Microsatellites and CubeSat technology |
| Space launch systems | 🇺🇸 🇨🇳 🇫🇷 🇨🇱 🇯🇵 | Orbital insertion and space access |
Source. GINC Data Laboratory, January 2026
Emerging National Assessments
GINC’s emerging national assessments use synthetic expert simulations to evaluate each nation across individual capabilities. For every capability, nations are assessed against a structured rubric ranging from No Plans (NP), indicating no current intention to develop the capability, through to AAA, representing performance at the global frontier.
Capability Groups, such as Quantum Computing, aggregate the underlying capability ratings to represent the group’s overall capability level. Within the Critical Technology domain, these groups, listed in figure 1, comprise between four and thirteen individual capabilities.
At the domain level, GINC expresses national capability in Critical Technology using the Pareto frontier, which evaluates nations based on whether they dominate, or are dominated by other nations across all underlying capabilities. Rather than weighting indices such as Capability Groups, the Pareto approach places countries into peer groups, or Tiers, according to their relative position and distance from the capability frontier.
Figure 2. Critical Technology Capability Tiers
| Country | Profile | Strength | Weakness |
|---|---|---|---|
| Tier 1. Frontier Nations | |||
| 🇺🇸 United States | Asymmetric | ||
| Tier 2 Nations | |||
| 🇰🇷 South Korea | Asymmetric | ||
| 🇩🇪 Germany | Asymmetric | ||
| 🇳🇱 Netherlands | Asymmetric | ||
| 🇸🇪 Sweden | Asymmetric | ||
| 🇮🇱 Israel | Asymmetric | ||
| 🇨🇳 China | Specialised | ||
| 🇨🇭 Switzerland | Specialised | ||
| Tier 3 Nations | |||
| 🇯🇵 Japan | Asymmetric | ||
| 🇫🇷 France | Asymmetric | ||
| Tier 4 Nations | |||
| 🇬🇧 United Kingdom | Asymmetric | ||
| 🇳🇴 Norway | Asymmetric | ||
| 🇨🇱 Chile | Asymmetric | ||
| 🇫🇮 Finland | Asymmetric | ||
| 🇸🇬 Singapore | Specialised | ||
| Tier 5 Nations | |||
| 🇦🇺 Australia | Asymmetric | ||
| 🇮🇹 Italy | Asymmetric | ||
| 🇨🇦 Canada | Asymmetric | ||
| 🇦🇹 Austria | Asymmetric | ||
| 🇷🇺 Russia | Asymmetric | ||
| 🇪🇸 Spain | Asymmetric | ||
| 🇧🇪 Belgium | Asymmetric | ||
| 🇩🇰 Denmark | Asymmetric | ||
| 🇦🇪 United Arab Emirates | Specialised | ||
| 🇮🇪 Ireland | Specialised | ||
Source. GINC Data Laboratory, January 2026
Further analysis of the Pareto Frontier reveals the complex patterns of capability dominance among top-tier nations. The capability domination matrix below illustrates these relationships in detail. To read the matrix: each cell shows how many capability groups the column country dominates the row country in. Dominance occurs when the column country scores strictly greater than (not equal to) the row country in a given capability group. For example, if the United States (column) versus Germany (row) shows a value of 8.1, this indicates that the US outperforms Germany in approximately 8 of the capability groups. The diagonal cells marked with "-" represent a country compared to itself. This matrix provides a nuanced view of competitive positioning that goes beyond simple rankings, revealing where specific countries hold advantages over their peers and the degree of those advantages across the critical technology landscape.
Figure 3. Capability Domination Matrix: Cross-National Performance Comparison
| 🇺🇸 US |
🇰🇷 KR |
🇩🇪 DE |
🇳🇱 NL |
🇸🇪 SE |
🇮🇱 IL |
🇨🇳 CN |
🇨🇭 CH |
🇯🇵 JP |
🇫🇷 FR |
|
|---|---|---|---|---|---|---|---|---|---|---|
| 🇺🇸 US |
- | 7.2 | 8.1 | 6.5 | 7.8 | 8.9 | 5.3 | 7.6 | 6.9 | 7.4 |
| 🇰🇷 KR |
6.8 | - | 7.3 | 5.9 | 6.4 | 7.1 | 8.2 | 6.7 | 8.5 | 6.2 |
| 🇩🇪 DE |
7.9 | 6.6 | - | 8.4 | 7.7 | 6.3 | 5.8 | 8.6 | 7.2 | 8.9 |
| 🇳🇱 NL |
6.1 | 7.5 | 8.3 | - | 7.9 | 6.8 | 5.4 | 8.1 | 6.7 | 7.3 |
| 🇸🇪 SE |
7.6 | 6.9 | 8.2 | 7.4 | - | 6.5 | 5.7 | 8.8 | 7.1 | 7.9 |
| 🇮🇱 IL |
8.4 | 7.8 | 6.2 | 7.1 | 6.6 | - | 5.9 | 7.5 | 6.8 | 7.3 |
| 🇨🇳 CN |
5.6 | 8.1 | 6.4 | 5.8 | 6.2 | 5.3 | - | 6.9 | 8.7 | 6.5 |
| 🇨🇭 CH |
7.7 | 6.3 | 8.5 | 7.9 | 8.2 | 7.1 | 6.4 | - | 7.6 | 8.3 |
| 🇯🇵 JP |
6.7 | 8.4 | 7.2 | 6.5 | 7.8 | 6.9 | 8.6 | 7.4 | - | 7.1 |
| 🇫🇷 FR |
7.3 | 6.8 | 8.7 | 7.6 | 7.2 | 6.4 | 5.9 | 8.1 | 7.5 | - |
Source. GINC Data Laboratory, January 2026
Capability Groups
Critical Technology is one of nine domains in the National Capability Framework, comprising 63 capabilities organized into eight capability groups. GINC's framework provides a standardized taxonomy that enables systematic cross-national comparison of technological capacity. Figure X presents the top five nations in each capability group, ranked by average capability score.
Figure 4. Top 5 Nations by Capability Group
| Capability Group | #1 | #2 | #3 | #4 | #5 |
|---|---|---|---|---|---|
| Advanced ICT | 🇺🇸 US · 17.7 |
🇮🇱 IL · 17.3 |
🇨🇳 CN · 16.7 |
🇸🇪 SE · 16.6 |
🇰🇷 KR · 16.4 |
| Advanced Materials | 🇺🇸 US · 17.3 |
🇨🇳 CN · 17.0 |
🇯🇵 JP · 16.6 |
🇩🇪 DE · 16.5 |
🇨🇭 CH · 16.4 |
| Artificial Intelligence | 🇺🇸 US · 18.8 |
🇰🇷 KR · 17.2 |
🇮🇱 IL · 16.8 |
🇨🇳 CN · 16.8 |
🇯🇵 JP · 16.7 |
| Biotech & Genetics | 🇺🇸 US · 18.6 |
🇨🇭 CH · 17.0 |
🇩🇪 DE · 16.7 |
🇳🇱 NL · 16.7 |
🇸🇪 SE · 16.7 |
| Energy Technology | 🇺🇸 US · 16.2 |
🇨🇳 CN · 16.1 |
🇯🇵 JP · 15.2 |
🇰🇷 KR · 15.2 |
🇸🇪 SE · 15.0 |
| Position, Navigation & Timing | 🇺🇸 US · 18.6 |
🇨🇳 CN · 17.0 |
🇩🇪 DE · 17.0 |
🇯🇵 JP · 17.0 |
🇬🇧 GB · 16.9 |
| Quantum Computing | 🇺🇸 US · 17.8 |
🇨🇳 CN · 17.5 |
🇨🇭 CH · 17.0 |
🇫🇷 FR · 16.8 |
🇳🇱 NL · 16.8 |
| Space, Robotics & Mobility | 🇺🇸 US · 16.8 |
🇨🇳 CN · 16.3 |
🇫🇷 FR · 15.6 |
🇯🇵 JP · 15.0 |
🇮🇱 IL · 14.2 |
Source. GINC Data Laboratory, January 2026
Advanced ICT shows tight clustering between 16-17 points. In Advanced Materials, China trails the US closely, with Japan, Germany, and Switzerland grouped together. The US leads AI significantly, with South Korea 1.6 points behind, followed by Israel, China, and Japan. The US dominates Biotech & Genetics. In Energy Technology, China trails the US by just 0.1 points. For Position, Navigation & Timing, the US leads substantially, with China, Germany, Japan, and the UK tightly clustered. In Quantum Computing, the US and China lead well ahead of Switzerland, France, and the Netherlands. For Space, Robotics & Mobility, the US leads China, which leads France, with Japan and Israel further behind.
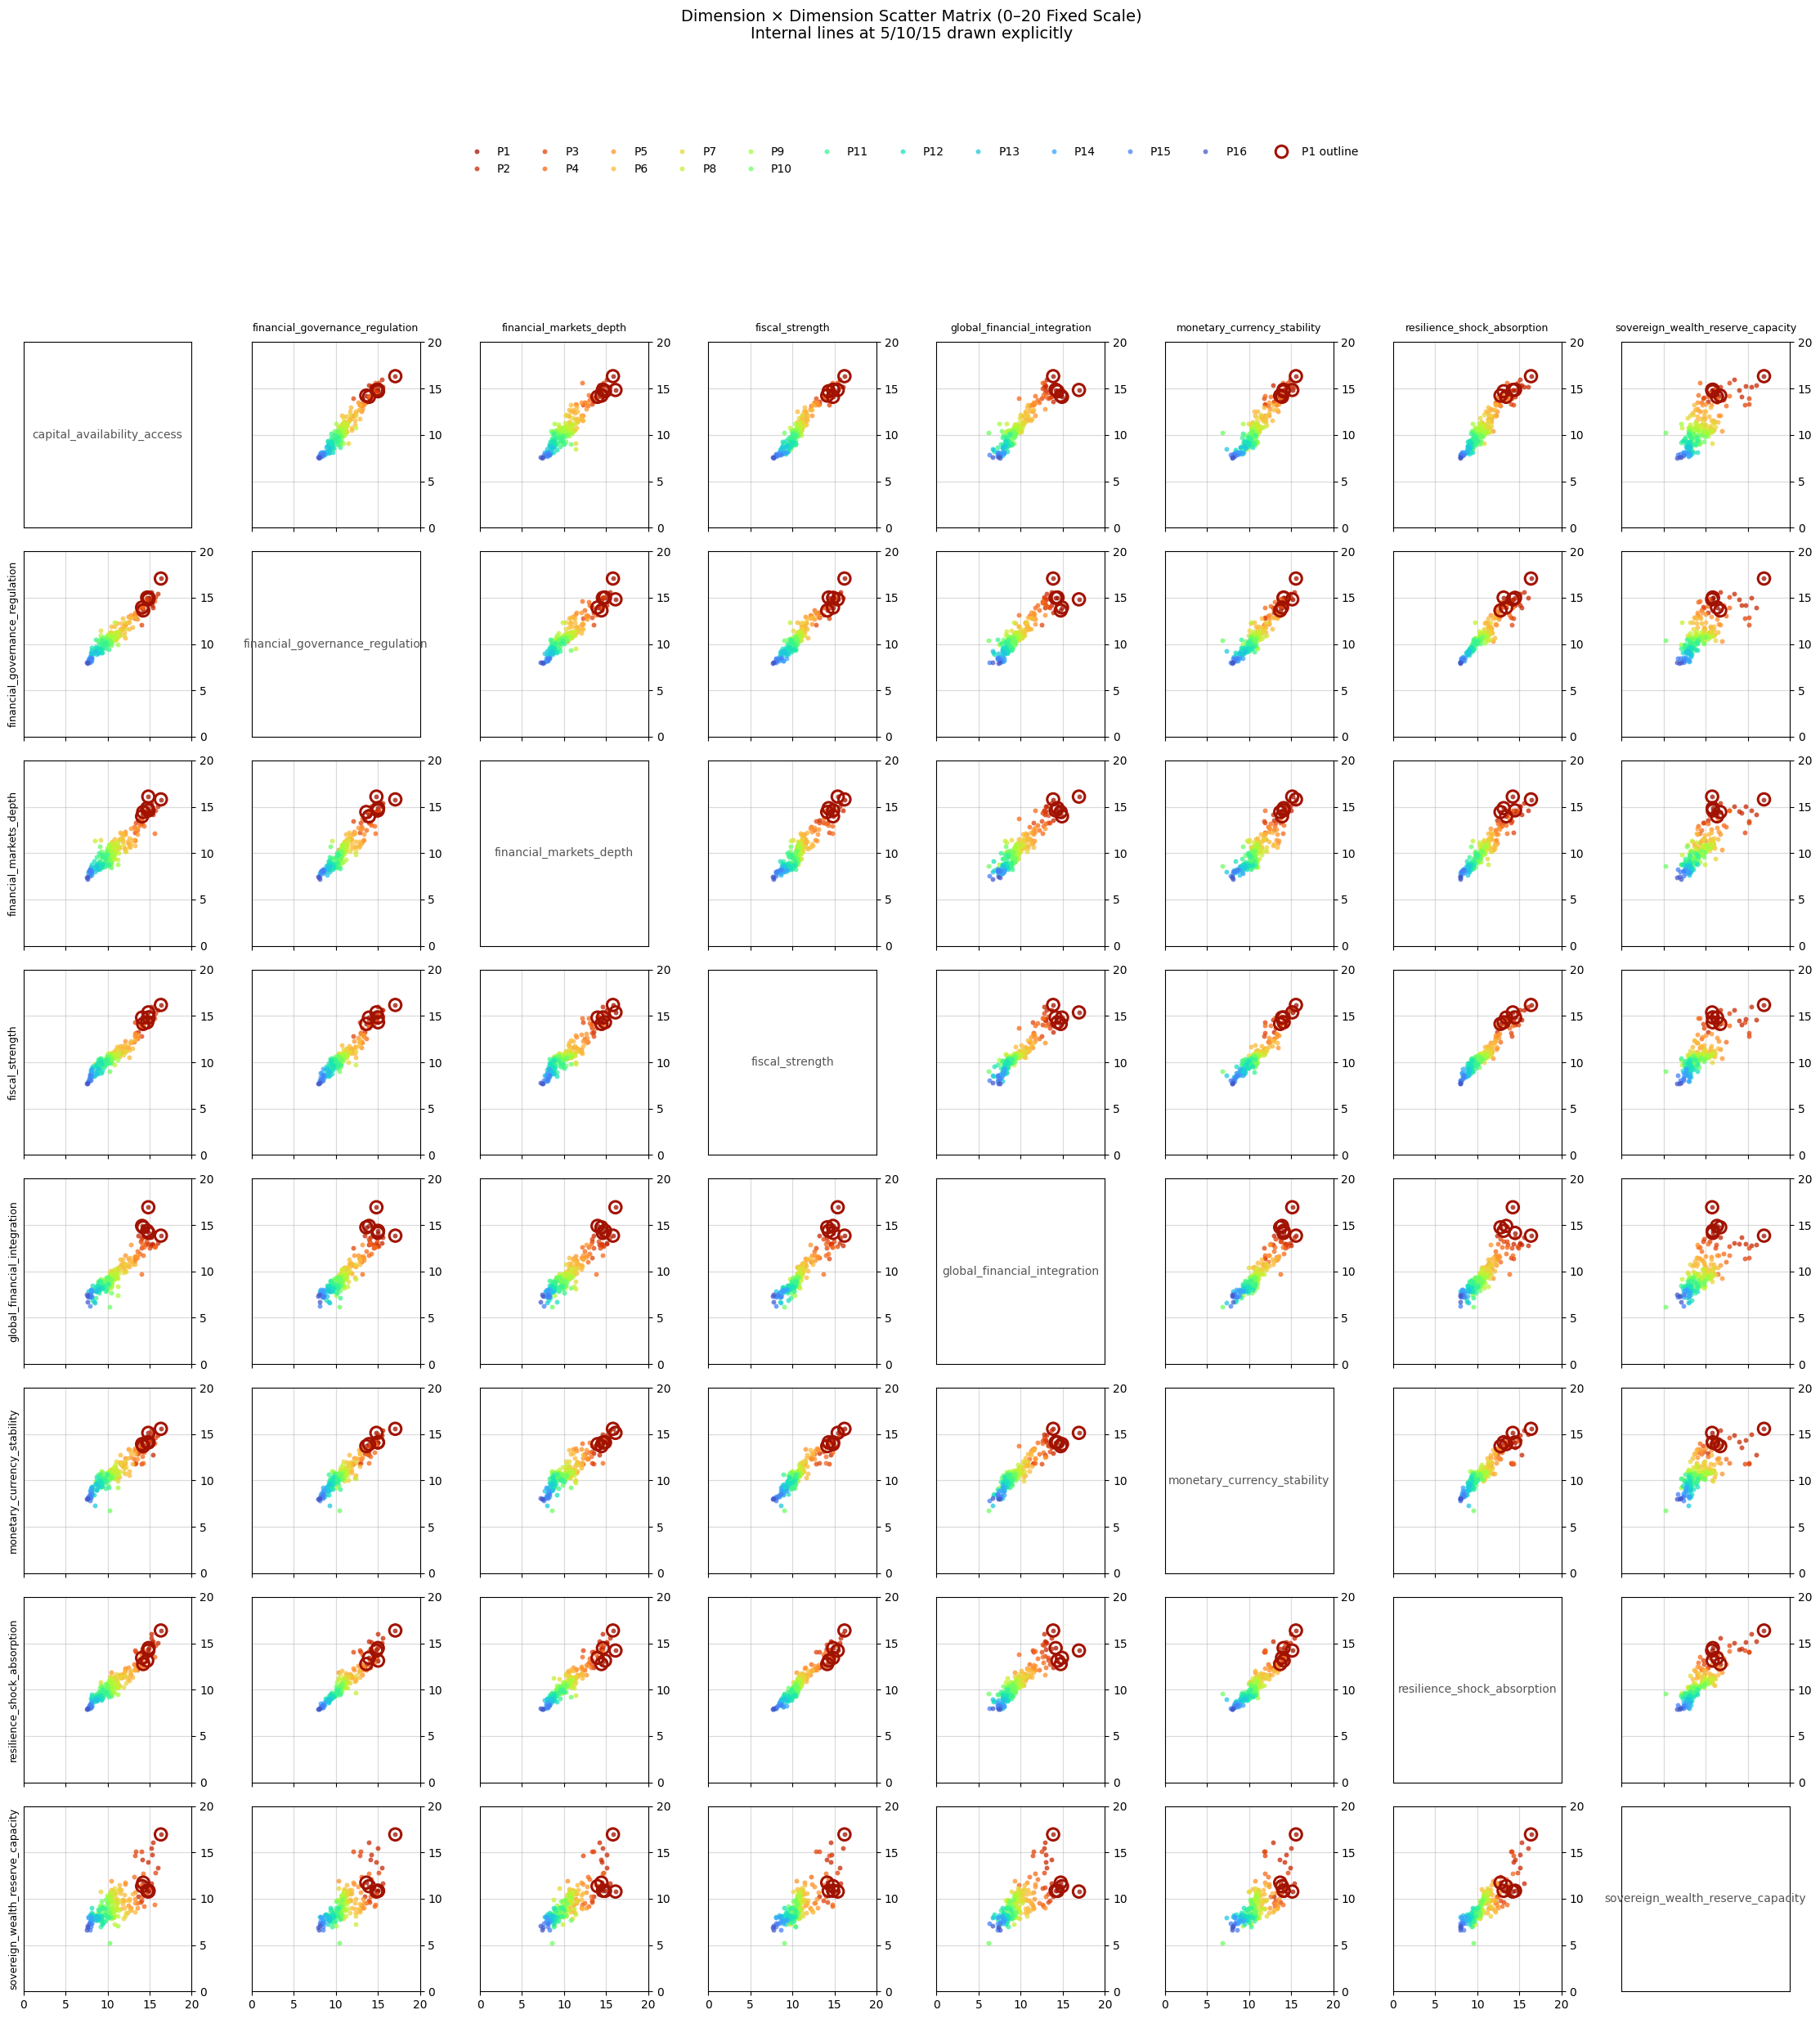
Examining capability group patterns across the 15 nations in Tiers 1, 2, and 3 reveals each nation's relative strengths and weaknesses. This analysis illustrates the three capability profiles, Balanced, Asymmetric, and Specialised, introduced in Figure 1, demonstrating how Pareto dominance evaluates performance across all dimensions simultaneously rather than relying on simple averages.
Figure 5. Capability Group Profiles of the Top 3 Tiers
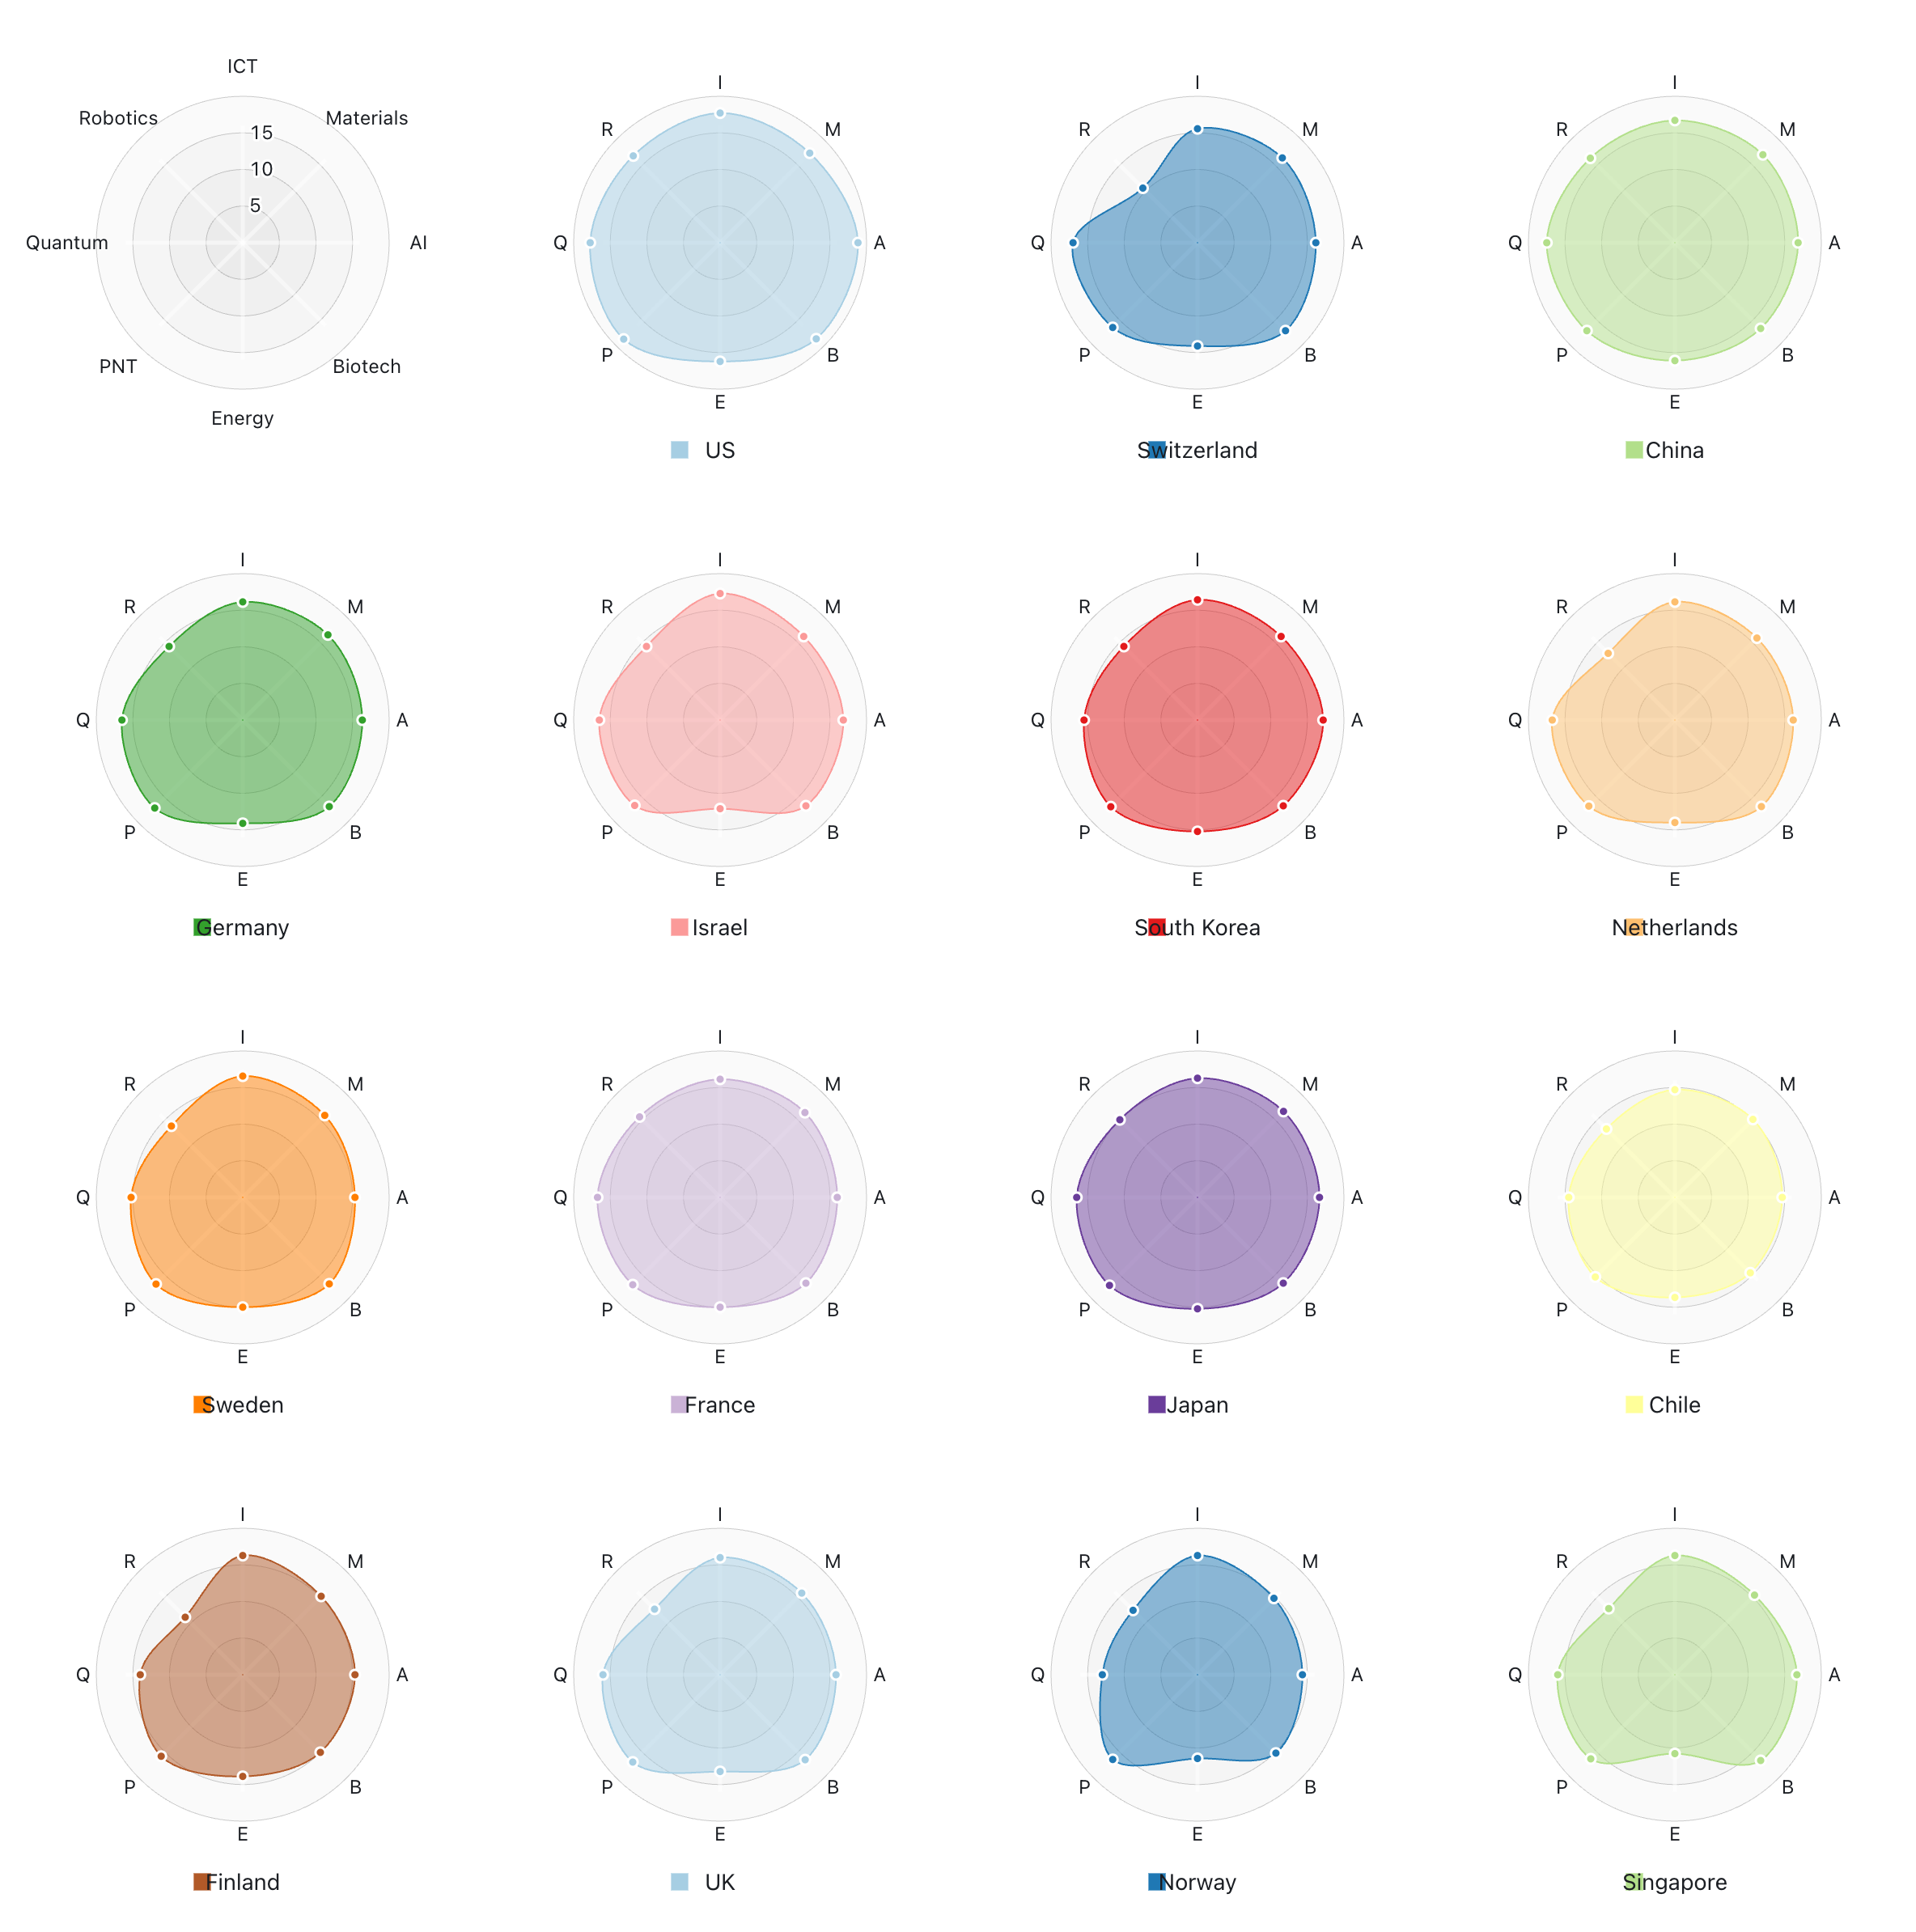
Source. GINC Data Laboratory, January 2026
Figure X reveals notable capability gaps: Switzerland and Finland show significant weaknesses in Robotics, while many nations lag in Energy Technology. The US dominance in AI is visually striking.
Figure X provides a broader view across all 200 assessed nations. Each vertical line represents one nation's capability group performance, with red lines marking the bottom quartile, median, and top quartile thresholds.
Figure 6. Global Capability Group Distribution
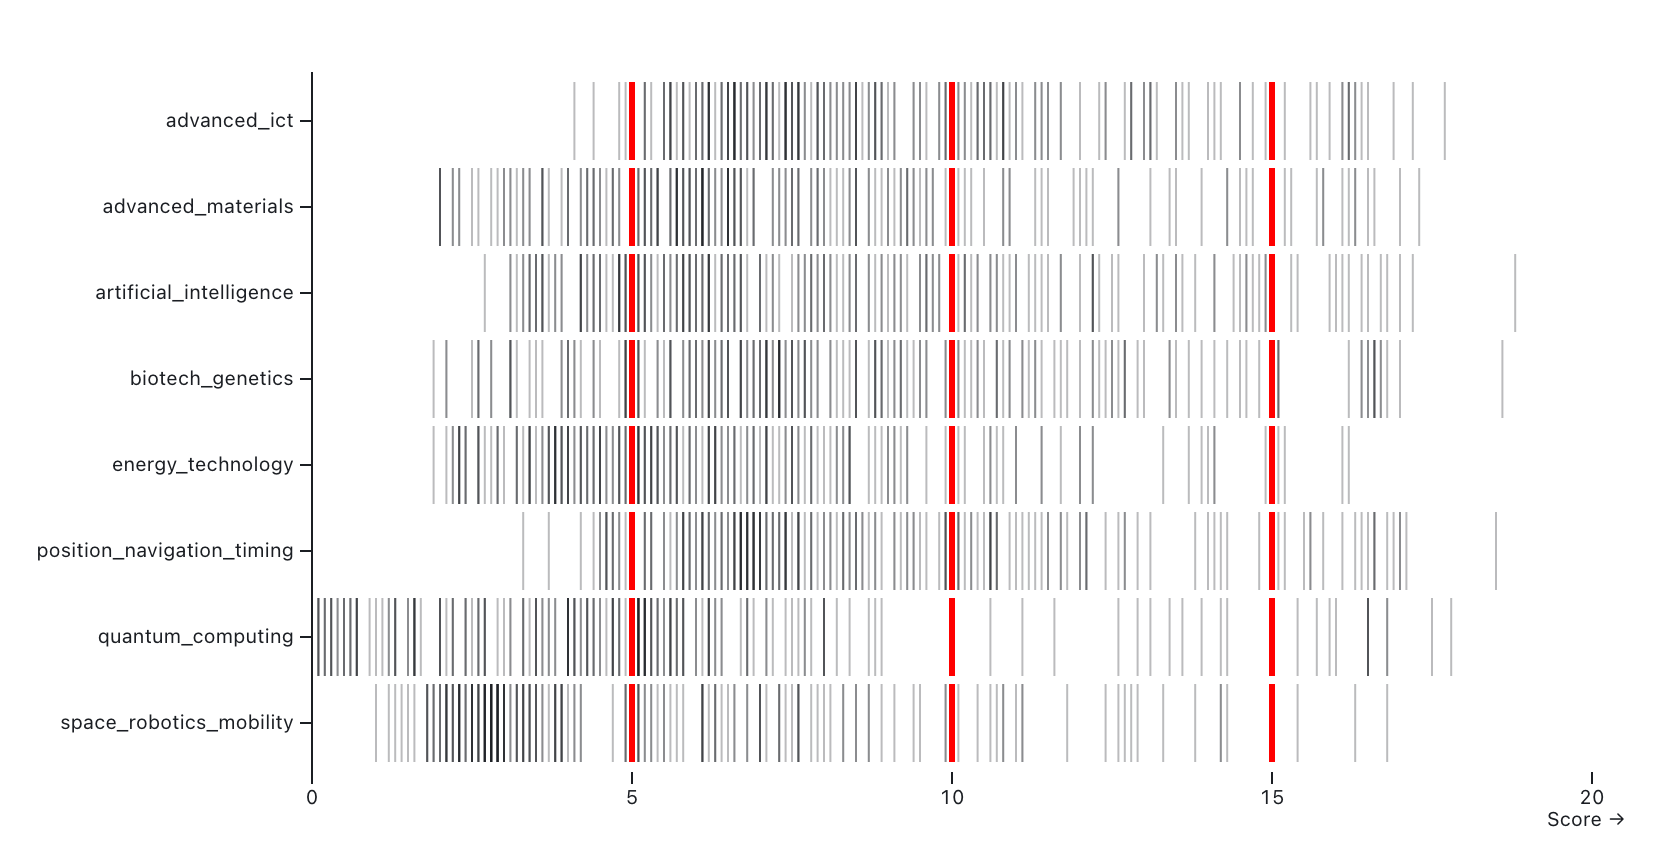
Source. GINC Data Laboratory, January 2026
Quantum Computing shows the lowest median score, followed by Space, Robotics & Mobility, reflecting the highly capital-intensive and technologically advanced nature of these capability groups. Energy Technology and Advanced Materials occupy the middle range, with Biotech & Genetics, Position, Navigation & Timing, and Advanced ICT showing higher median scores, indicating these domains benefit from the broader digital transformation underway across most nations. Examining outliers reveals the US maintains particularly strong leads in Artificial Intelligence, Biotech & Genetics, and Position, Navigation & Timing, with more moderate advantages in Advanced ICT, Quantum Computing, and Space, Robotics & Mobility.
Advanced ICT
Advanced ICT encompasses seven underlying capabilities spanning the full spectrum of secure communications, distributed systems, and high-performance computing infrastructure. These capabilities range from advanced optical and radiofrequency communication systems through to protective cybersecurity technologies and mesh networks that operate independently of traditional infrastructure.
Figure 7. Advanced ICT Capabilities. Frontier Nations and Global Rating Distribution
| Capabilities | Frontier | Advanced | Developed | Intermediate | Foundation | Emerging | Planning |
|---|---|---|---|---|---|---|---|
| Advanced optical communication | 🇺🇸 | 43 | 53 | 68 | 50 | – | – |
| Advanced radiofrequency communication | 🇺🇸 | 48 | 48 | 91 | 27 | – | – |
| Advanced undersea wireless communication | – | 18 | 11 | 28 | 61 | 66 | 31 |
| Distributed ledgers | – | 24 | 26 | 40 | 48 | 77 | – |
| High performance computing | 🇺🇸 | 20 | 19 | 35 | 88 | 39 | 13 |
| Mesh infrastructure independent networks | – | 6 | 12 | 34 | 74 | 89 | – |
| Protective cyber security technologies | 🇪🇪 🇮🇱 | 26 | 34 | 84 | 68 | 1 | – |
Source. GINC Data Laboratory, January 2026
The capability rankings presented in Figure 7 highlight nations demonstrating frontier-level performance—those operating at the global cutting edge in each specific technology domain. What becomes immediately apparent from this analysis is the concentration of capability at the frontier: only a handful of nations consistently achieve the highest performance tiers across Advanced ICT capabilities. The United States and China dominate most capability rankings, with Israel emerging as a notable leader in mesh networks and cybersecurity technologies—domains that align closely with the nation's strategic security priorities.
The distribution across rating categories reveals a striking pattern: relatively few nations qualify as "Advanced" performers, while the majority cluster in the "Developed" category. This suggests that while many countries have implemented foundational ICT capabilities and maintain functional systems, achieving genuine technological leadership requires sustained investment, specialized expertise, and institutional depth that remains concentrated among a small group of nations. The "Other" category, encompassing over 100 nations in most capabilities, reflects countries still building basic infrastructure or those that have not prioritized these particular technology domains in their national strategies.
Artificial Intelligence
Artificial Intelligence encompasses six underlying capabilities that together span the full AI stack, from foundational data analytics and core machine learning techniques through to advanced algorithms, specialised hardware accelerators, and adversarial applications. These capabilities capture both the general-purpose systems that underpin widespread AI adoption and the more specialised components—such as integrated circuit design and AI-specific hardware—that determine performance, scalability, and strategic advantage across civilian and defence contexts.
Figure 8. Artificial Intelligence Capabilities. Frontier Nations and Global Rating Distribution
| Capabilities | Frontier | Advanced | Developed | Intermediate | Foundation | Emerging | Planning |
|---|---|---|---|---|---|---|---|
| Advanced data analytics | 🇺🇸 | 39 | 44 | 75 | 55 | 1 | – |
| Advanced integrated circuit design fabrication | 🇰🇷 🇹🇼 | 9 | 5 | 30 | 37 | 44 | 88 |
| Adversarial AI | 🇺🇸 | 15 | 16 | 32 | 69 | 69 | 13 |
| AI algorithms hardware accelerators | 🇺🇸 | 10 | 15 | 36 | 69 | 71 | 13 |
| Machine learning | 🇺🇸 | 31 | 22 | 51 | 64 | 46 | – |
| Natural language processing | 🇺🇸 | 33 | 21 | 52 | 71 | 37 | – |
Source. GINC Data Laboratory, January 2026
Across the AI capability set, a clear differentiation emerges between capabilities that are broadly diffused and those that remain structurally constrained. Core techniques such as machine learning and natural language processing show comparatively larger Advanced and Developed cohorts, indicating that these capabilities have transitioned into widely accessible platforms supported by global research communities, open-source tooling, and commercial ecosystems. In contrast, capabilities tied to specialised infrastructure—particularly advanced integrated circuit design and AI hardware accelerators—exhibit much thinner upper tiers and a pronounced tail of countries in the Emerging and Planning categories. This divergence underscores the role of capital intensity, fabrication access, and supply-chain control in shaping national AI capability profiles.
A second pattern is the asymmetry between algorithmic maturity and deployment depth. Adversarial AI and advanced analytics show substantial populations in the Intermediate and Foundation tiers, suggesting many countries possess applied expertise or niche deployments without having consolidated these into system-level capability. This gap points to challenges not of basic competence, but of integration—scaling models, embedding them into institutions, and sustaining performance under operational and security constraints. The relatively large Intermediate cohorts in these areas imply latent capability that could move upward rapidly with targeted investment and policy alignment.
Finally, the distribution highlights that AI capability progression is not linear across domains. Countries may demonstrate strength in data analytics or application-level AI while remaining significantly constrained in hardware, fabrication, or accelerator design. This creates a fragmented capability landscape in which national AI strategies are increasingly defined by bottlenecks rather than headline performance. The persistence of large Planning and Emerging groups in hardware-intensive capabilities suggests that, absent deliberate intervention, these gaps are likely to endure—reinforcing structural advantages for countries that already control critical elements of the AI value chain.
Space, Robotics & Mobility
Space, robotics and mobility encompasses nine underlying capabilities that together span the full spectrum of autonomous platforms, propulsion systems, space access, and advanced operational technologies. These capabilities range from advanced aircraft engines and air-independent propulsion systems through to autonomous robotics, underwater vehicles, drone swarms, hypersonic detection, and space-based platforms such as small satellites and launch systems. Collectively, they capture both the enabling industrial foundations required to build and sustain complex platforms and the higher-order systems integration challenges—autonomy, coordination, sensing, and launch—that shape operational reach, resilience, and strategic advantage across defence, security, and dual-use civilian applications.
Figure 9. Space, Robotics & Mobility Capabilities. Frontier Nations and Global Rating Distribution
| Capabilities | Frontier | Advanced | Developed | Intermediate | Foundation | Emerging | Planning |
|---|---|---|---|---|---|---|---|
| Advanced aircraft engines | – | 1 | 4 | 3 | 10 | 55 | 142 |
| Advanced robotics | 🇺🇸 | 22 | 20 | 31 | 41 | 97 | 3 |
| Air independent propulsion | – | 5 | 5 | 6 | 12 | 13 | 174 |
| Autonomous systems operation technologies | 🇺🇸 | 22 | 21 | 44 | 51 | 76 | – |
| Autonomous underwater vehicles | – | 16 | 15 | 28 | 41 | 92 | 23 |
| Drones swarming collaborative robots | – | 16 | 13 | 10 | 45 | 131 | – |
| Hypersonic detection tracking | – | 2 | 6 | 19 | 47 | 30 | 111 |
| Small satellites | 🇺🇸 | 16 | 12 | 28 | 30 | 88 | 40 |
| Space launch systems | 🇺🇸 | 3 | 5 | 3 | 13 | 32 | 158 |
Source. GINC Data Laboratory, January 2026
The capability rankings presented in this figure highlight a markedly uneven distribution of frontier-level performance across space, robotics, and mobility technologies. Frontier leadership is concentrated in a small subset of capabilities, most notably advanced robotics, autonomous systems operation technologies, small satellites, and space launch systems, where the United States consistently occupies the highest tier. In contrast, several propulsion- and detection-focused capabilities—such as advanced aircraft engines, air-independent propulsion, and hypersonic detection and tracking—show no clear frontier leaders, indicating either unresolved technical barriers, limited diffusion beyond classified or niche programmes, or persistent challenges in scaling these systems to operational maturity. This pattern underscores that leadership in this domain is not uniform, but clustered around capabilities where software integration, systems engineering, and platform coordination are decisive.
The distribution across rating categories further reveals a structural divide between deployable autonomy and heavy industrial or propulsion-intensive systems. Autonomous robotics, drones, underwater vehicles, and satellite platforms exhibit relatively larger Advanced and Developed cohorts, suggesting broader global experimentation and incremental adoption. By contrast, capabilities such as space launch systems, advanced aircraft engines, and hypersonic detection show exceptionally large Planning and Emerging populations, reflecting the high capital intensity, long development cycles, and regulatory or security constraints associated with these technologies. Taken together, the data suggest that while autonomy and small-platform space technologies are diffusing steadily, the industrial and propulsion foundations required for sustained aerospace and hypersonic capability remain concentrated, reinforcing long-term barriers to entry for most nations.
Quantum
Quantum technologies encompass four closely related capabilities that span the development of secure communications, next-generation computation, and ultra-precise sensing. These capabilities range from post-quantum cryptography, which underpins the resilience of digital systems against future cryptanalytic threats, through to quantum communication, general-purpose quantum computing, and quantum sensors that enable new classes of secure networks, computational performance, and measurement precision. Together, they reflect a domain where theoretical advances, specialised hardware, and tightly controlled research ecosystems converge, shaping long-term strategic advantage in both civilian and national-security contexts while remaining highly sensitive to scientific maturity, infrastructure depth, and sustained investment.
Figure 10. Quantum Capabilities. Frontier Nations and Global Rating Distribution
| Capabilities | Frontier | Advanced | Developed | Intermediate | Foundation | Emerging | Planning |
|---|---|---|---|---|---|---|---|
| Post quantum cryptography | – | 15 | 15 | 26 | 52 | 75 | 32 |
| Quantum communication | 🇨🇳 | 12 | 5 | 6 | 15 | 106 | 70 |
| Quantum computing general | 🇺🇸 | 13 | 5 | 4 | 19 | 89 | 84 |
| Quantum sensors | 🇺🇸 | 16 | 5 | 4 | 30 | 114 | 45 |
Source. GINC Data Laboratory, January 2026
The distribution across rating categories reinforces the early-stage and structurally constrained nature of the quantum domain. Advanced and Developed cohorts are relatively thin across all four capabilities, while large populations cluster in the Intermediate, Foundation, Emerging, and Planning tiers—particularly in quantum communication and general quantum computing. This pattern reflects the combination of high scientific uncertainty, specialised infrastructure requirements, and long development timelines that characterise quantum technologies. While many countries are actively investing in foundational research and exploratory programmes, the data suggest that translating these efforts into mature, deployable systems remains challenging, leaving sustained quantum leadership confined to a small number of states with deep research ecosystems, patient capital, and long-term strategic commitment.The capability rankings presented in this figure illustrate a highly uneven and still-emerging landscape across quantum technologies. Frontier-level performance is limited to a small number of capabilities, with leadership concentrated in quantum communication and quantum computing–related domains. China’s position at the frontier in quantum communication contrasts with United States leadership in general quantum computing and quantum sensors, highlighting a bifurcation between communications-focused and computation- or sensing-focused quantum strategies. Notably, post-quantum cryptography shows no frontier leaders, suggesting that while the capability is widely recognised as strategically important, it remains in a transitional phase where standards, implementation pathways, and large-scale deployment have yet to consolidate into clear technological leadership.
Position, Navigation & Timing
Position, Navigation & Timing encompasses eight interrelated capabilities that underpin precise sensing, navigation resilience, and situational awareness across contested environments. These capabilities range from foundational timekeeping and inertial systems—such as atomic clocks and inertial navigation—through to advanced sensing modalities including radar, sonar, photonic sensors, magnetic and gravitational field sensors, and multispectral imaging. Together, they form the technical backbone for assured navigation, targeting, and detection in domains where external signals may be degraded or denied, linking high-precision instrumentation with systems integration and signal processing to deliver strategic advantage across defence, aerospace, maritime, and critical infrastructure applications.
Figure 11. Position, Navigation & Timing Capabilities. Frontier Nations and Global Rating Distribution
| Capabilities | Frontier | Advanced | Developed | Intermediate | Foundation | Emerging | Planning |
|---|---|---|---|---|---|---|---|
| Atomic clocks | 🇺🇸 | 18 | 16 | 36 | 77 | 31 | 36 |
| Gravitational force sensors | – | 12 | 16 | 25 | 84 | 75 | 3 |
| Inertial navigation systems | 🇺🇸 | 20 | 23 | 58 | 102 | 11 | – |
| Magnetic field sensors | – | 20 | 27 | 60 | 104 | 4 | – |
| Multispectral hyperspectral imaging sensors | 🇺🇸 | 20 | 15 | 54 | 90 | 35 | – |
| Photonic sensors | 🇺🇸 | 26 | 18 | 38 | 74 | 58 | – |
| Radar | 🇺🇸 | 27 | 31 | 72 | 83 | 1 | – |
| Sonar acoustic sensors | 🇺🇸 | 20 | 19 | 64 | 92 | 14 | 5 |
Source. GINC Data Laboratory, January 2026
The distribution across rating categories reveals a pronounced skew toward the Intermediate and Foundation tiers, particularly in sensing-heavy capabilities such as magnetic field sensors, multispectral imaging, and gravitational sensing. While Advanced and Developed cohorts are present across most capabilities, they remain relatively modest compared with the large populations of countries still building baseline competence or adapting these technologies for specific use cases. This pattern suggests that while precision navigation and sensing systems are widely recognised as strategically important, achieving high reliability, integration resilience, and performance under contested conditions remains difficult. As a result, the upper tiers continue to be dominated by a small number of countries with deep scientific expertise, defence-driven demand, and the institutional capacity to translate laboratory-scale precision into operational advantage.The capability rankings presented in this figure highlight a domain where frontier performance is comparatively well defined and concentrated across multiple sensing and navigation technologies. The United States occupies the frontier tier in the majority of Position, Navigation & Timing capabilities, including atomic clocks, inertial navigation systems, radar, sonar, photonic sensors, and multispectral imaging. This concentration reflects long-standing investment in precision timing, sensing, and signal-processing infrastructures that underpin military, aerospace, and critical infrastructure applications. In contrast, capabilities such as gravitational force sensors and magnetic field sensors show no clear frontier leaders, indicating either narrower operational deployment, ongoing technical challenges, or a greater reliance on experimental and research-driven development rather than mature system integration.
Energy Technology
Energy Technology encompasses nine diverse capabilities that together span power generation, storage, conversion, and energy-related military applications. These capabilities range from mature energy systems—such as biofuels, nuclear energy, photovoltaics, and electric batteries—through to emerging and highly specialised technologies including hydrogen–ammonia power chains, supercapacitors, nuclear waste recycling, and directed energy systems. Collectively, they capture both the civilian energy transition and the defence-oriented dimensions of energy technology, where scale, reliability, and supply-chain control intersect with strategic considerations such as energy security, resilience, and the ability to project or sustain power across contested and resource-constrained environments.
Figure 12. Energy Technology Capabilities. Frontier Nations and Global Rating Distribution
| Capabilities | Frontier | Advanced | Developed | Intermediate | Foundation | Emerging | Planning |
|---|---|---|---|---|---|---|---|
| Biofuels | 🇧🇷 | 6 | 24 | 31 | 59 | 90 | 4 |
| Directed energy technologies | – | 7 | 6 | 7 | 22 | 85 | 88 |
| Electric batteries | 🇨🇳 | 12 | 12 | 46 | 133 | 11 | – |
| Electronic warfare | 🇺🇸 🇮🇱 | 21 | 18 | 55 | 92 | 18 | 9 |
| Hydrogen ammonia for power | – | 8 | 4 | 21 | 102 | 80 | – |
| Nuclear energy | – | 9 | 17 | 7 | 5 | 10 | 167 |
| Nuclear waste management recycling | – | 5 | 16 | 29 | 75 | 51 | 39 |
| Photovoltaics | 🇨🇳 | 21 | 43 | 94 | 52 | 3 | – |
| Supercapacitors | – | 8 | 9 | 12 | 42 | 118 | 26 |
Source. GINC Data Laboratory, January 2026
The capability rankings presented in this figure reveal a highly differentiated landscape across energy technologies, with frontier leadership distributed unevenly across both civilian and defence-oriented domains. Frontier performance is evident in a small number of capabilities, most notably biofuels, electric batteries, photovoltaics, and electronic warfare–related energy systems. Leadership in these areas reflects a combination of scale, industrial integration, and sustained investment in energy-intensive manufacturing and defence applications. In contrast, several core energy technologies—including nuclear energy, hydrogen–ammonia power systems, supercapacitors, and directed energy technologies—show no clear frontier leaders, suggesting that technical complexity, regulatory constraints, and long development horizons continue to limit the emergence of globally dominant performers.
The distribution across rating categories highlights a pronounced bifurcation between mature, industrialised energy technologies and those still constrained by deployment and systems-integration challenges. Capabilities such as electric batteries and photovoltaics exhibit relatively large Advanced and Developed cohorts, indicating broad global adoption and incremental optimisation across supply chains. By contrast, nuclear-related technologies, directed energy systems, and emerging storage technologies display exceptionally large Planning and Emerging populations, reflecting high capital requirements, long project cycles, and significant policy or safety barriers. Taken together, the data suggest that while many countries are actively pursuing energy transition and security objectives, sustained leadership remains concentrated in capabilities where industrial scale, manufacturing depth, and strategic alignment have already been achieved, leaving more complex or capital-intensive domains lagging behind.
Biotech & Genetics
Biotech & Genetics encompasses seven interconnected capabilities that together span the full lifecycle of biological discovery, production, and medical application. These capabilities range from foundational genetic engineering and genomic sequencing through to large-scale biological manufacturing, synthetic biology, nuclear medicine, and the development of vaccines and medical countermeasures. Collectively, they capture a domain where scientific research, industrial bioprocessing, and health security intersect, shaping national capacity to innovate, respond to biological threats, and translate laboratory advances into scalable clinical and strategic outcomes across both civilian healthcare systems and defence-related preparedness contexts.
Figure 13. Biotech & Genetics Capabilities. Frontier Nations and Global Rating Distribution
| Capabilities | Frontier | Advanced | Developed | Intermediate | Foundation | Emerging | Planning |
|---|---|---|---|---|---|---|---|
| Biological manufacturing | 🇺🇸 | 15 | 17 | 36 | 80 | 50 | 16 |
| Genetic engineering | 🇺🇸 | 26 | 22 | 39 | 90 | 33 | 4 |
| Genomic sequencing analysis | 🇺🇸 | 36 | 31 | 65 | 60 | 22 | – |
| Novel antibiotics antivirals | – | 10 | 14 | 29 | 57 | 70 | 35 |
| Nuclear medicine radiation therapy | 🇺🇸 | 22 | 31 | 54 | 59 | 18 | 30 |
| Synthetic biology | 🇺🇸 | 19 | 20 | 30 | 76 | 53 | 16 |
| Vaccines medical countermeasures | 🇺🇸 | 19 | 32 | 77 | 86 | – | – |
Source. GINC Data Laboratory, January 2026
The capability rankings presented in this figure indicate a domain where frontier leadership is comparatively concentrated and consistently held across multiple biotech and genetics capabilities. The United States occupies the frontier tier in the majority of areas, including biological manufacturing, genetic engineering, genomic sequencing, nuclear medicine, synthetic biology, and vaccines and medical countermeasures. This pattern reflects the cumulative advantage of long-term investment in life sciences research, clinical translation, and large-scale biomanufacturing infrastructure, as well as the integration of public health, defence, and industrial ecosystems. In contrast, novel antibiotics and antivirals show no clear frontier leaders, underscoring the scientific, regulatory, and commercial challenges that continue to constrain innovation and sustained leadership in this particularly complex and risk-intensive area.
The distribution across rating categories reveals a broad base of global participation coupled with persistent challenges in scaling and deployment. While Advanced and Developed cohorts are substantial across most capabilities—particularly in genomic sequencing and vaccines—large Intermediate and Foundation populations remain evident, indicating that many countries possess functional research or production capacity without fully mature or resilient systems. The sizeable Emerging and Planning cohorts in areas such as novel antimicrobials and biological manufacturing suggest uneven prioritisation and structural barriers, including capital intensity, regulatory complexity, and supply-chain dependencies. Overall, the data point to a biotechnology landscape in which scientific competence is increasingly widespread, but durable leadership remains tied to the ability to translate discovery into scalable, regulated, and strategically integrated capabilities.
Advanced Materials
Advanced Materials encompasses thirteen interdependent capabilities that collectively underpin modern manufacturing, defence systems, and high-performance industrial applications. These capabilities range from additive manufacturing and high-specification machining processes through to advanced composites, coatings, energetic materials, and next-generation semiconductors, as well as critical enabling inputs such as magnets, superconductors, and strategically important mineral processing. Together, they represent a domain where materials science, precision engineering, and supply-chain control converge, shaping the ability to design, produce, and sustain advanced platforms and infrastructure while conferring long-term strategic advantage through control of specialised materials, manufacturing processes, and critical inputs.
Figure 13. Advanced Materials Capabilities. Frontier Nations and Global Rating Distribution
| Capabilities | Frontier | Advanced | Developed | Intermediate | Foundation | Emerging | Planning |
|---|---|---|---|---|---|---|---|
| Additive manufacturing | 🇺🇸 | 23 | 22 | 34 | 63 | 72 | – |
| Advanced coatings | – | 19 | 10 | 29 | 41 | 106 | 10 |
| Advanced composite materials | 🇺🇸 | 22 | 20 | 46 | 101 | 23 | 2 |
| Advanced explosives and energetic materials | 🇺🇸 | 21 | 14 | 52 | 92 | 23 | 12 |
| Advanced magnets and superconductors | – | 11 | 10 | 15 | 42 | 79 | 58 |
| Advanced protection | 🇺🇸 | 29 | 33 | 86 | 66 | – | – |
| Continuous flow chemical synthesis | – | 17 | 13 | 34 | 40 | 86 | 25 |
| Critical minerals extraction processing | 🇨🇳 | 1 | 9 | 63 | 87 | 19 | 35 |
| High specification machining processes | 🇨🇭 🇯🇵 | 29 | 25 | 57 | 84 | 17 | 1 |
| Nanoscale materials and manufacturing | 🇺🇸 | 17 | 9 | 34 | 48 | 79 | 27 |
| Novel metamaterials | 🇺🇸 | 16 | 8 | 14 | 32 | 116 | 28 |
| Smart materials | – | 19 | 13 | 23 | 47 | 103 | 10 |
| Wide and ultrawide bandgap semiconductors | – | 6 | 8 | 8 | 21 | 75 | 97 |
Source. GINC Data Laboratory, January 2026
The capability rankings presented in this figure show a domain where frontier leadership is both diversified across capabilities and unevenly distributed by technological function. Frontier performance is evident in several manufacturing- and protection-oriented capabilities, including additive manufacturing, advanced composites, energetic materials, advanced protection systems, nanoscale materials, and novel metamaterials, with the United States frequently occupying the highest tier. In contrast, leadership in critical inputs and enabling foundations—such as advanced magnets and superconductors, wide and ultrawide bandgap semiconductors, and continuous-flow chemical synthesis—remains less clearly defined, while China’s frontier position in critical minerals extraction and processing highlights the strategic importance of upstream resource control within the advanced materials ecosystem. The presence of Switzerland and Japan at the frontier in high-specification machining further underscores the role of precision engineering and industrial craftsmanship in sustaining leadership at the materials frontier.
The distribution across rating categories reveals a pronounced stratification between application-facing materials and deeper industrial or supply-chain capabilities. Capabilities such as advanced protection, composites, and machining show substantial Advanced and Developed cohorts, indicating relatively broad diffusion among industrialised economies. By contrast, materials tied to complex physics, specialised fabrication, or long development cycles—such as superconductors, metamaterials, and next-generation semiconductors—exhibit large Emerging and Planning populations, reflecting high barriers to entry and persistent technical uncertainty. This pattern suggests that while many countries can adopt or adapt advanced materials for specific uses, sustained leadership depends on mastering upstream processes, precision manufacturing, and critical inputs—areas where capability accumulation is slower and structural advantages are harder to erode.
National Case Studies
The following country case studies examine how leading and peer nations perform across the Critical Technology domain, combining Pareto Tier placement, overall capability profile (balanced, specialised, or asymmetric), and detailed performance across individual capability groups. Each case begins by situating the country relative to the global Pareto frontier—indicating whether it is non-dominated or constrained by structural gaps—before analysing group-level scores, rankings, and the spread between minimum and maximum ratings. Together, these perspectives highlight not only where nations lead or lag, but how their technological strength is distributed, where depth or fragility exists, and what this implies for long-term power, resilience, and strategic autonomy.
🇺🇸 United States. Tier 1 (Frontier), Asymmetric
The United States sits alone in Tier 1, occupying the global Pareto frontier for Critical Technology. Its overall profile is asymmetric, not because of weakness, but due to the sheer scale and diversity of its technology base: leadership is distributed unevenly across an exceptionally large system. Rather than a tightly clustered profile, the U.S. frontier position reflects multiple peaks of excellence across domains, combined with depth and redundancy that prevent domination by any peer.
At the capability-group level, the U.S. ranks first across all eight groups, with Artificial Intelligence, Position, Navigation & Timing, and Biotech & Genetics reaching AAA at the upper bound. Minimum ratings in areas such as Energy Technology and Advanced Materials fall several bands lower, but the wide min–max spread reflects system breadth and heterogeneity rather than structural gaps. Overall, the U.S. profile is characterised by sustained frontier leadership, strong average scores, and resilience across the full critical technology stack.
Figure 15. Critical Technology - US Capability Group Benchmarks
| Capability Group | Min Rating | Max Rating | Avg Score | Rank |
|---|---|---|---|---|
| 🇺🇸 Position, Navigation & Timing | BBB | AAA | 18.6 | 1 |
| 🇺🇸 Artificial Intelligence | BBB | AAA | 18.8 | 1 |
| 🇺🇸 Biotech & Genetics | BB | AAA | 18.6 | 1 |
| 🇺🇸 Advanced ICT | B | AAA | 17.7 | 1 |
| 🇺🇸 Space, Robotics & Mobility | EE | AAA | 16.8 | 1 |
| 🇺🇸 Quantum Computing | BBB | AA | 17.8 | 1 |
| 🇺🇸 Energy Technology | CC | AA | 16.2 | 1 |
| 🇺🇸 Advanced Materials | C | AA | 17.3 | 1 |
Source. GINC Data Laboratory, January 2026
🇨🇳 China. Tier 2, Specialised
China sits in Tier 2, immediately below the frontier, with a clearly specialised Pareto profile. Its position reflects strong performance in selected domains that approach frontier levels, while other areas lag sufficiently to prevent non-domination. China’s Tier 2 placement indicates proximity to the frontier, but with structural dependencies that remain binding constraints.
At the capability-group level, China performs most strongly in Advanced Materials, Quantum Computing, and Position, Navigation & Timing, all of which post high average scores and competitive rankings. However, the spread between minimum and maximum ratings is wide across nearly all groups, signalling uneven depth and concentration of capability. Lower minimum ratings in Energy Technology and Biotech & Genetics highlight gaps in maturity and consistency. China’s profile reflects rapid advancement and scale in priority areas, alongside variability across the broader technology base.
Figure 16. Critical Technology - China Capability Group Benchmarks
| Capability Group | Min Rating | Max Rating | Avg Score | Rank |
|---|---|---|---|---|
| 🇨🇳 Energy Technology | C | AAA | 16.1 | 2 |
| 🇨🇳 Quantum Computing | BBB | AA | 17.5 | 2 |
| 🇨🇳 Advanced Materials | BB | A | 17.0 | 2 |
| 🇨🇳 Position, Navigation & Timing | BBB | BBB | 17.0 | 2 |
| 🇨🇳 Space, Robotics & Mobility | CCC | BBB | 16.3 | 2 |
| 🇨🇳 Advanced ICT | B | BBB | 16.7 | 3 |
| 🇨🇳 Artificial Intelligence | BB | BBB | 16.8 | 3 |
| 🇨🇳 Biotech & Genetics | CCC | BBB | 16.6 | 6 |
Source. GINC Data Laboratory, January 2026
🇮🇱 Israel. Tier 2, Asymmetric
Israel sits within Tier 2 with an asymmetric profile shaped by concentrated centres of excellence rather than broad coverage. Its Pareto position reflects strong non-domination in select domains, offset by structural limitations in capital-intensive and system-scale technologies. Israel’s Tier 2 placement underscores high innovation intensity but constrained depth.
At the capability-group level, Israel’s strongest performance is in Advanced ICT and Artificial Intelligence, where group scores and rankings remain competitive despite the country’s smaller industrial base. In contrast, Energy Technology and Space, Robotics & Mobility show lower average scores and wider min–max spreads, indicating reliance on external ecosystems. Overall, Israel’s profile is defined by sharp peaks of capability, wide internal variance, and limited system-level redundancy.
Figure 17. Critical Technology - Israel Capability Group Benchmarks
| Capability Group | Min Rating | Max Rating | Avg Score | Rank |
|---|---|---|---|---|
| 🇮🇱 Advanced ICT | BBB | AA | 17.3 | 2 |
| 🇮🇱 Artificial Intelligence | BB | BBB | 16.8 | 3 |
| 🇮🇱 Space, Robotics & Mobility | EE | BBB | 14.2 | 5 |
| 🇮🇱 Quantum Computing | BB | BBB | 16.5 | 6 |
| 🇮🇱 Biotech & Genetics | B | BBB | 16.6 | 6 |
| 🇮🇱 Advanced Materials | DDD | BBB | 16.2 | 7 |
| 🇮🇱 Position, Navigation & Timing | CC | BBB | 16.5 | 10 |
| 🇮🇱 Energy Technology | LP | A | 12.1 | 15 |
Source. GINC Data Laboratory, January 2026
🇰🇷 South Korea. Tier 2, Asymmetric
South Korea occupies Tier 2 with an asymmetric profile anchored in advanced manufacturing, applied R&D, and scalable production systems. Its Pareto position reflects strong competitiveness in several domains, but insufficient breadth to achieve non-domination across the full capability set.
Capability-group performance is strongest in Artificial Intelligence, Position, Navigation & Timing, and Advanced ICT, where scores reflect effective integration of digital systems with industrial capacity. However, Energy Technology and Quantum Computing exhibit lower rankings and wider min–max spreads, pointing to uneven development and reliance on select national champions. South Korea’s profile shows effective concentration of strength in production-oriented technologies, with gaps in capital-intensive frontier domains.
Figure 18. Critical Technology - South Korea Capability Group Benchmarks
| Capability Group | Min Rating | Max Rating | Avg Score | Rank |
|---|---|---|---|---|
| 🇰🇷 Artificial Intelligence | BBB | A | 17.2 | 2 |
| 🇰🇷 Energy Technology | DDD | BBB | 15.2 | 3 |
| 🇰🇷 Advanced ICT | CC | BBB | 16.4 | 5 |
| 🇰🇷 Space, Robotics & Mobility | EE | BBB | 14.2 | 5 |
| 🇰🇷 Biotech & Genetics | CCC | BBB | 16.6 | 6 |
| 🇰🇷 Position, Navigation & Timing | B | BBB | 16.8 | 7 |
| 🇰🇷 Advanced Materials | DDD | BBB | 16.2 | 7 |
| 🇰🇷 Quantum Computing | B | BB | 15.5 | 11 |
Source. GINC Data Laboratory, January 2026
🇩🇪 Germany. Tier 2, Asymmetric
Germany sits in Tier 2 with an asymmetric but relatively balanced profile compared with other Tier 2 peers. While not on the frontier, Germany avoids domination through consistent mid-to-high performance across multiple domains, supported by institutional depth and industrial coherence.
Germany’s strongest capability groups are Position, Navigation & Timing, Biotech & Genetics, and Advanced Materials, all of which show solid average scores and comparatively narrow spreads between minimum and maximum ratings. Lower scores in Space, Robotics & Mobility and Energy Technology reflect structural and policy constraints rather than capability absence. Overall, Germany’s profile is marked by stability, engineering strength, and breadth, with fewer extreme peaks but strong system integration.
Figure 19. Critical Technology - German Capability Group Benchmarks
| Capability Group | Min Rating | Max Rating | Avg Score | Rank |
|---|---|---|---|---|
| 🇩🇪 Position, Navigation & Timing | BBB | BBB | 17.0 | 2 |
| 🇩🇪 Biotech & Genetics | B | BBB | 16.7 | 3 |
| 🇩🇪 Advanced Materials | DDD | BBB | 16.5 | 4 |
| 🇩🇪 Space, Robotics & Mobility | EE | BBB | 14.2 | 5 |
| 🇩🇪 Quantum Computing | BB | BBB | 16.5 | 6 |
| 🇩🇪 Energy Technology | EE | BBB | 14.1 | 7 |
| 🇩🇪 Artificial Intelligence | B | BBB | 16.3 | 7 |
| 🇩🇪 Advanced ICT | CC | BBB | 16.1 | 10 |
Source. GINC Data Laboratory, January 2026
Scenarios and Sensitivity Analysis
Pareto Sensitivity
Data and Definitions