Critical Technology. GINC's Emerging National Assessments
How advanced technologies shape power, prosperity, and resilience, have driven the rise and decline of nations, and define the current leaders in critical technology

- Summary
- Bullet
- Bullet
From industrialisation to the digital age, the rise and decline of nations has been repeatedly shaped by their ability to develop, scale, and control critical technologies.
Critical Technology comprises the advanced, high-impact technological capabilities that underpin a nation’s power, prosperity, and resilience, shaping its military and strategic advantage, economic competitiveness and growth, and capacity to withstand, adapt to, and recover from systemic shocks, while determining its freedom of action and vulnerability in an increasingly contested global environment.
This research note provides a comprehensive assessment of national capability in critical technology across multiple dimensions. We introduce the domain and its strategic significance, present high-level national assessments using Pareto frontier methodology, and conduct detailed analysis of each of GINC's eight capability groups. The analysis includes five national case studies examining diverse strategic approaches, scenario testing and sensitivity analysis of national assessments, and exploration of data patterns including correlations between capability groups and alignment with published national framework definitions.
Contents
Introduction
National Assessments
Capability Groups
National Case Studies
Scenarios and Sensitivity Analysis
Data and Definitions
Introduction
Critical Technology is one of nine domains assessed within the National Capability Framework and one of three domains that comprise the Hard Power pillar. It aggregates 63 underlying capabilities, organised into eight capability groups, which together define a nation’s critical technology capacity. GINC's Critical Technology framework provides a standardized taxonomy that maps to published national definitions, enabling systematic comparison of technological capabilities across diverse strategic approaches and policy frameworks.
Figure 1. Critical Capability Domain Overview
| Capability Group | Caps | Short Description |
|---|---|---|
| Advanced ICT | 7 | Secure networks, communications, ledgers, and high-performance computing. |
| Advanced Materials | 13 | Advanced manufacturing, novel materials, protection, and critical minerals. |
| Artificial Intelligence | 6 | AI/ML, analytics, NLP, adversarial AI, and accelerators. |
| Biotech & Genetics | 7 | Genomics, synthetic biology, biomanufacturing, and medical countermeasures. |
| Energy Technology | 9 | Generation, storage, nuclear, renewables, and directed-energy systems. |
| Position, Navigation & Timing | 8 | Timing and sensing: clocks, inertial, radar/sonar, and photonics. |
| Quantum Computing | 4 | Quantum compute, comms, sensing, and post-quantum crypto. |
| Space, Robotics & Mobility | 9 | Space systems, autonomy, robotics, propulsion, and advanced platforms. |
| Total | 63 |
Emerging National Assessments
GINC’s emerging national assessments use synthetic expert simulations to evaluate each nation across individual capabilities. For every capability, nations are assessed against a structured rubric ranging from No Plans (NP), indicating no current intention to develop the capability, through to AAA, representing performance at the global frontier.
Capability Groups, such as Quantum Computing, aggregate the underlying capability ratings to represent the group’s overall capability level. Within the Critical Technology domain, these groups, listed in figure 1, comprise between four and thirteen individual capabilities.
At the domain level, GINC expresses national capability in Critical Technology using the Pareto frontier, which evaluates nations based on whether they dominate, or are dominated by other nations across all underlying capabilities. Rather than weighting indices such as Capability Groups, the Pareto approach places countries into peer groups, or Tiers, according to their relative position and distance from the capability frontier.
Figure 2. Critical Technology Capability Tiers
| Country | Profile | Strength | Weakness |
|---|---|---|---|
| Tier 1. Frontier Nations | |||
| 🇺🇸 United States | Asymmetric | ||
| Tier 2 Nations | |||
| 🇰🇷 South Korea | Asymmetric | ||
| 🇩🇪 Germany | Asymmetric | ||
| 🇳🇱 Netherlands | Asymmetric | ||
| 🇸🇪 Sweden | Asymmetric | ||
| 🇮🇱 Israel | Asymmetric | ||
| 🇨🇳 China | Specialised | ||
| 🇨🇭 Switzerland | Specialised | ||
| Tier 3 Nations | |||
| 🇯🇵 Japan | Asymmetric | ||
| 🇫🇷 France | Asymmetric | ||
| Tier 4 Nations | |||
| 🇬🇧 United Kingdom | Asymmetric | ||
| 🇳🇴 Norway | Asymmetric | ||
| 🇨🇱 Chile | Asymmetric | ||
| 🇫🇮 Finland | Asymmetric | ||
| 🇸🇬 Singapore | Specialised | ||
| Tier 5 Nations | |||
| 🇦🇺 Australia | Asymmetric | ||
| 🇮🇹 Italy | Asymmetric | ||
| 🇨🇦 Canada | Asymmetric | ||
| 🇦🇹 Austria | Asymmetric | ||
| 🇷🇺 Russia | Asymmetric | ||
| 🇪🇸 Spain | Asymmetric | ||
| 🇧🇪 Belgium | Asymmetric | ||
| 🇩🇰 Denmark | Asymmetric | ||
| 🇦🇪 United Arab Emirates | Specialised | ||
| 🇮🇪 Ireland | Specialised | ||
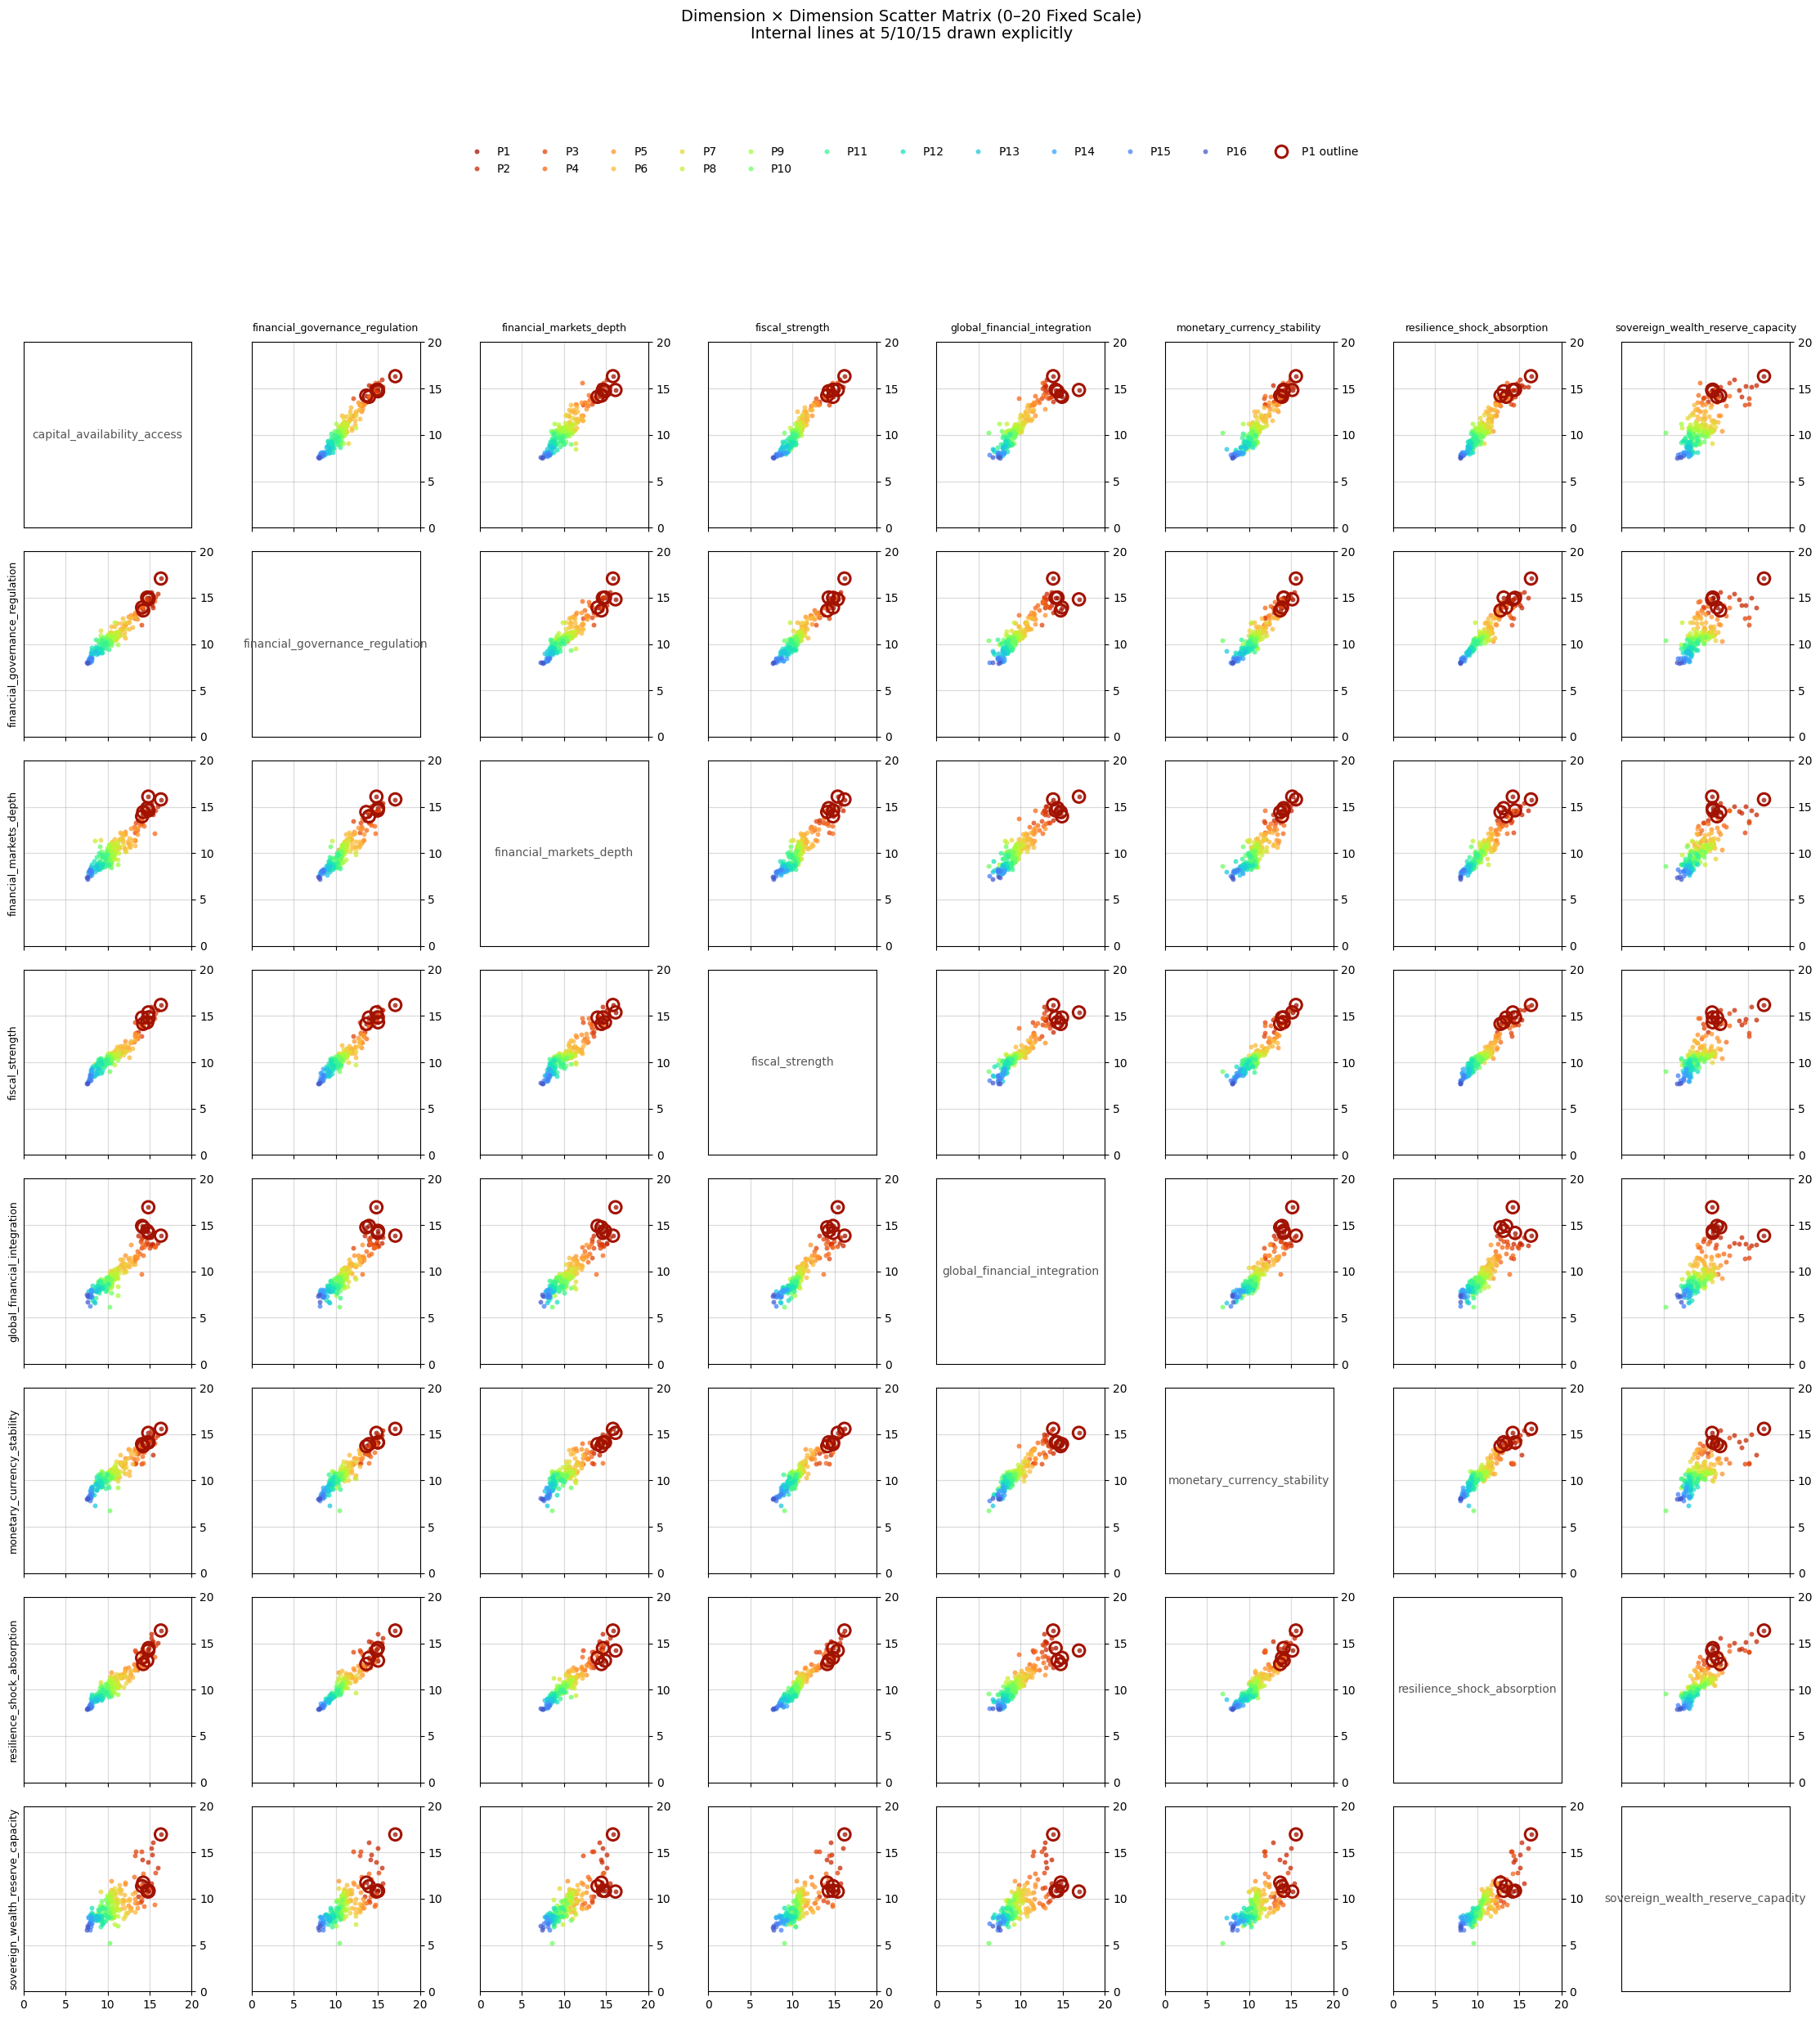
Further analysis of the Pareto Frontier reveals the complex patterns of capability dominance among top-tier nations. The capability domination matrix below illustrates these relationships in detail. To read the matrix: each cell shows how many capability groups the column country dominates the row country in. Dominance occurs when the column country scores strictly greater than (not equal to) the row country in a given capability group. For example, if the United States (column) versus Germany (row) shows a value of 8.1, this indicates that the US outperforms Germany in approximately 8 of the capability groups. The diagonal cells marked with "-" represent a country compared to itself. This matrix provides a nuanced view of competitive positioning that goes beyond simple rankings, revealing where specific countries hold advantages over their peers and the degree of those advantages across the critical technology landscape.
Figure X. Capability Domination Matrix: Cross-National Performance Comparison
| 🇺🇸 US |
🇰🇷 KR |
🇩🇪 DE |
🇳🇱 NL |
🇸🇪 SE |
🇮🇱 IL |
🇨🇳 CN |
🇨🇭 CH |
🇯🇵 JP |
🇫🇷 FR |
|
|---|---|---|---|---|---|---|---|---|---|---|
| 🇺🇸 US |
- | 7.2 | 8.1 | 6.5 | 7.8 | 8.9 | 5.3 | 7.6 | 6.9 | 7.4 |
| 🇰🇷 KR |
6.8 | - | 7.3 | 5.9 | 6.4 | 7.1 | 8.2 | 6.7 | 8.5 | 6.2 |
| 🇩🇪 DE |
7.9 | 6.6 | - | 8.4 | 7.7 | 6.3 | 5.8 | 8.6 | 7.2 | 8.9 |
| 🇳🇱 NL |
6.1 | 7.5 | 8.3 | - | 7.9 | 6.8 | 5.4 | 8.1 | 6.7 | 7.3 |
| 🇸🇪 SE |
7.6 | 6.9 | 8.2 | 7.4 | - | 6.5 | 5.7 | 8.8 | 7.1 | 7.9 |
| 🇮🇱 IL |
8.4 | 7.8 | 6.2 | 7.1 | 6.6 | - | 5.9 | 7.5 | 6.8 | 7.3 |
| 🇨🇳 CN |
5.6 | 8.1 | 6.4 | 5.8 | 6.2 | 5.3 | - | 6.9 | 8.7 | 6.5 |
| 🇨🇭 CH |
7.7 | 6.3 | 8.5 | 7.9 | 8.2 | 7.1 | 6.4 | - | 7.6 | 8.3 |
| 🇯🇵 JP |
6.7 | 8.4 | 7.2 | 6.5 | 7.8 | 6.9 | 8.6 | 7.4 | - | 7.1 |
| 🇫🇷 FR |
7.3 | 6.8 | 8.7 | 7.6 | 7.2 | 6.4 | 5.9 | 8.1 | 7.5 | - |
Capability Groups
Critical Technology is one of nine domains in the National Capability Framework and comprises 63 capabilities across eight groups. GINC's framework provides standardized taxonomy enabling systematic comparison across nations. Using Pareto methodology, Figure X shows the top 5 nations per capability group.
Figure X. Top 5 Nations by Group
| Capability Group | #1 | #2 | #3 | #4 | #5 |
|---|---|---|---|---|---|
| Advanced ICT | 🇺🇸 US · 17.7 |
🇮🇱 IL · 17.3 |
🇨🇳 CN · 16.7 |
🇸🇪 SE · 16.6 |
🇰🇷 KR · 16.4 |
| Advanced Materials | 🇺🇸 US · 17.3 |
🇨🇳 CN · 17.0 |
🇯🇵 JP · 16.6 |
🇩🇪 DE · 16.5 |
🇨🇭 CH · 16.4 |
| Artificial Intelligence | 🇺🇸 US · 18.8 |
🇰🇷 KR · 17.2 |
🇮🇱 IL · 16.8 |
🇨🇳 CN · 16.8 |
🇯🇵 JP · 16.7 |
| Biotech & Genetics | 🇺🇸 US · 18.6 |
🇨🇭 CH · 17.0 |
🇩🇪 DE · 16.7 |
🇳🇱 NL · 16.7 |
🇸🇪 SE · 16.7 |
| Energy Technology | 🇺🇸 US · 16.2 |
🇨🇳 CN · 16.1 |
🇯🇵 JP · 15.2 |
🇰🇷 KR · 15.2 |
🇸🇪 SE · 15.0 |
| Position, Navigation & Timing | 🇺🇸 US · 18.6 |
🇨🇳 CN · 17.0 |
🇩🇪 DE · 17.0 |
🇯🇵 JP · 17.0 |
🇬🇧 GB · 16.9 |
| Quantum Computing | 🇺🇸 US · 17.8 |
🇨🇳 CN · 17.5 |
🇨🇭 CH · 17.0 |
🇫🇷 FR · 16.8 |
🇳🇱 NL · 16.8 |
| Space, Robotics & Mobility | 🇺🇸 US · 16.8 |
🇨🇳 CN · 16.3 |
🇫🇷 FR · 15.6 |
🇯🇵 JP · 15.0 |
🇮🇱 IL · 14.2 |
Advanced ICT shows tight clustering between 16-17 points. In Advanced Materials, China trails the US closely, with Japan, Germany, and Switzerland grouped together. The US leads AI significantly, with South Korea 1.6 points behind, followed by Israel, China, and Japan. The US dominates Biotech & Genetics. In Energy Technology, China trails the US by just 0.1 points. For Position, Navigation & Timing, the US leads substantially, with China, Germany, Japan, and the UK tightly clustered. In Quantum Computing, the US and China lead well ahead of Switzerland, France, and the Netherlands. For Space, Robotics & Mobility, the US leads China, which leads France, with Japan and Israel further behind.
Examining capability group patterns across the 15 nations in Tiers 1, 2, and 3 reveals each nation's relative strengths and weaknesses. This analysis illustrates the three capability profiles, Balanced, Asymmetric, and Specialised, introduced in Figure 1, demonstrating how Pareto dominance evaluates performance across all dimensions simultaneously rather than relying on simple averages.
Figure 3. Capability Group Profiles of the Top 3 Tiers
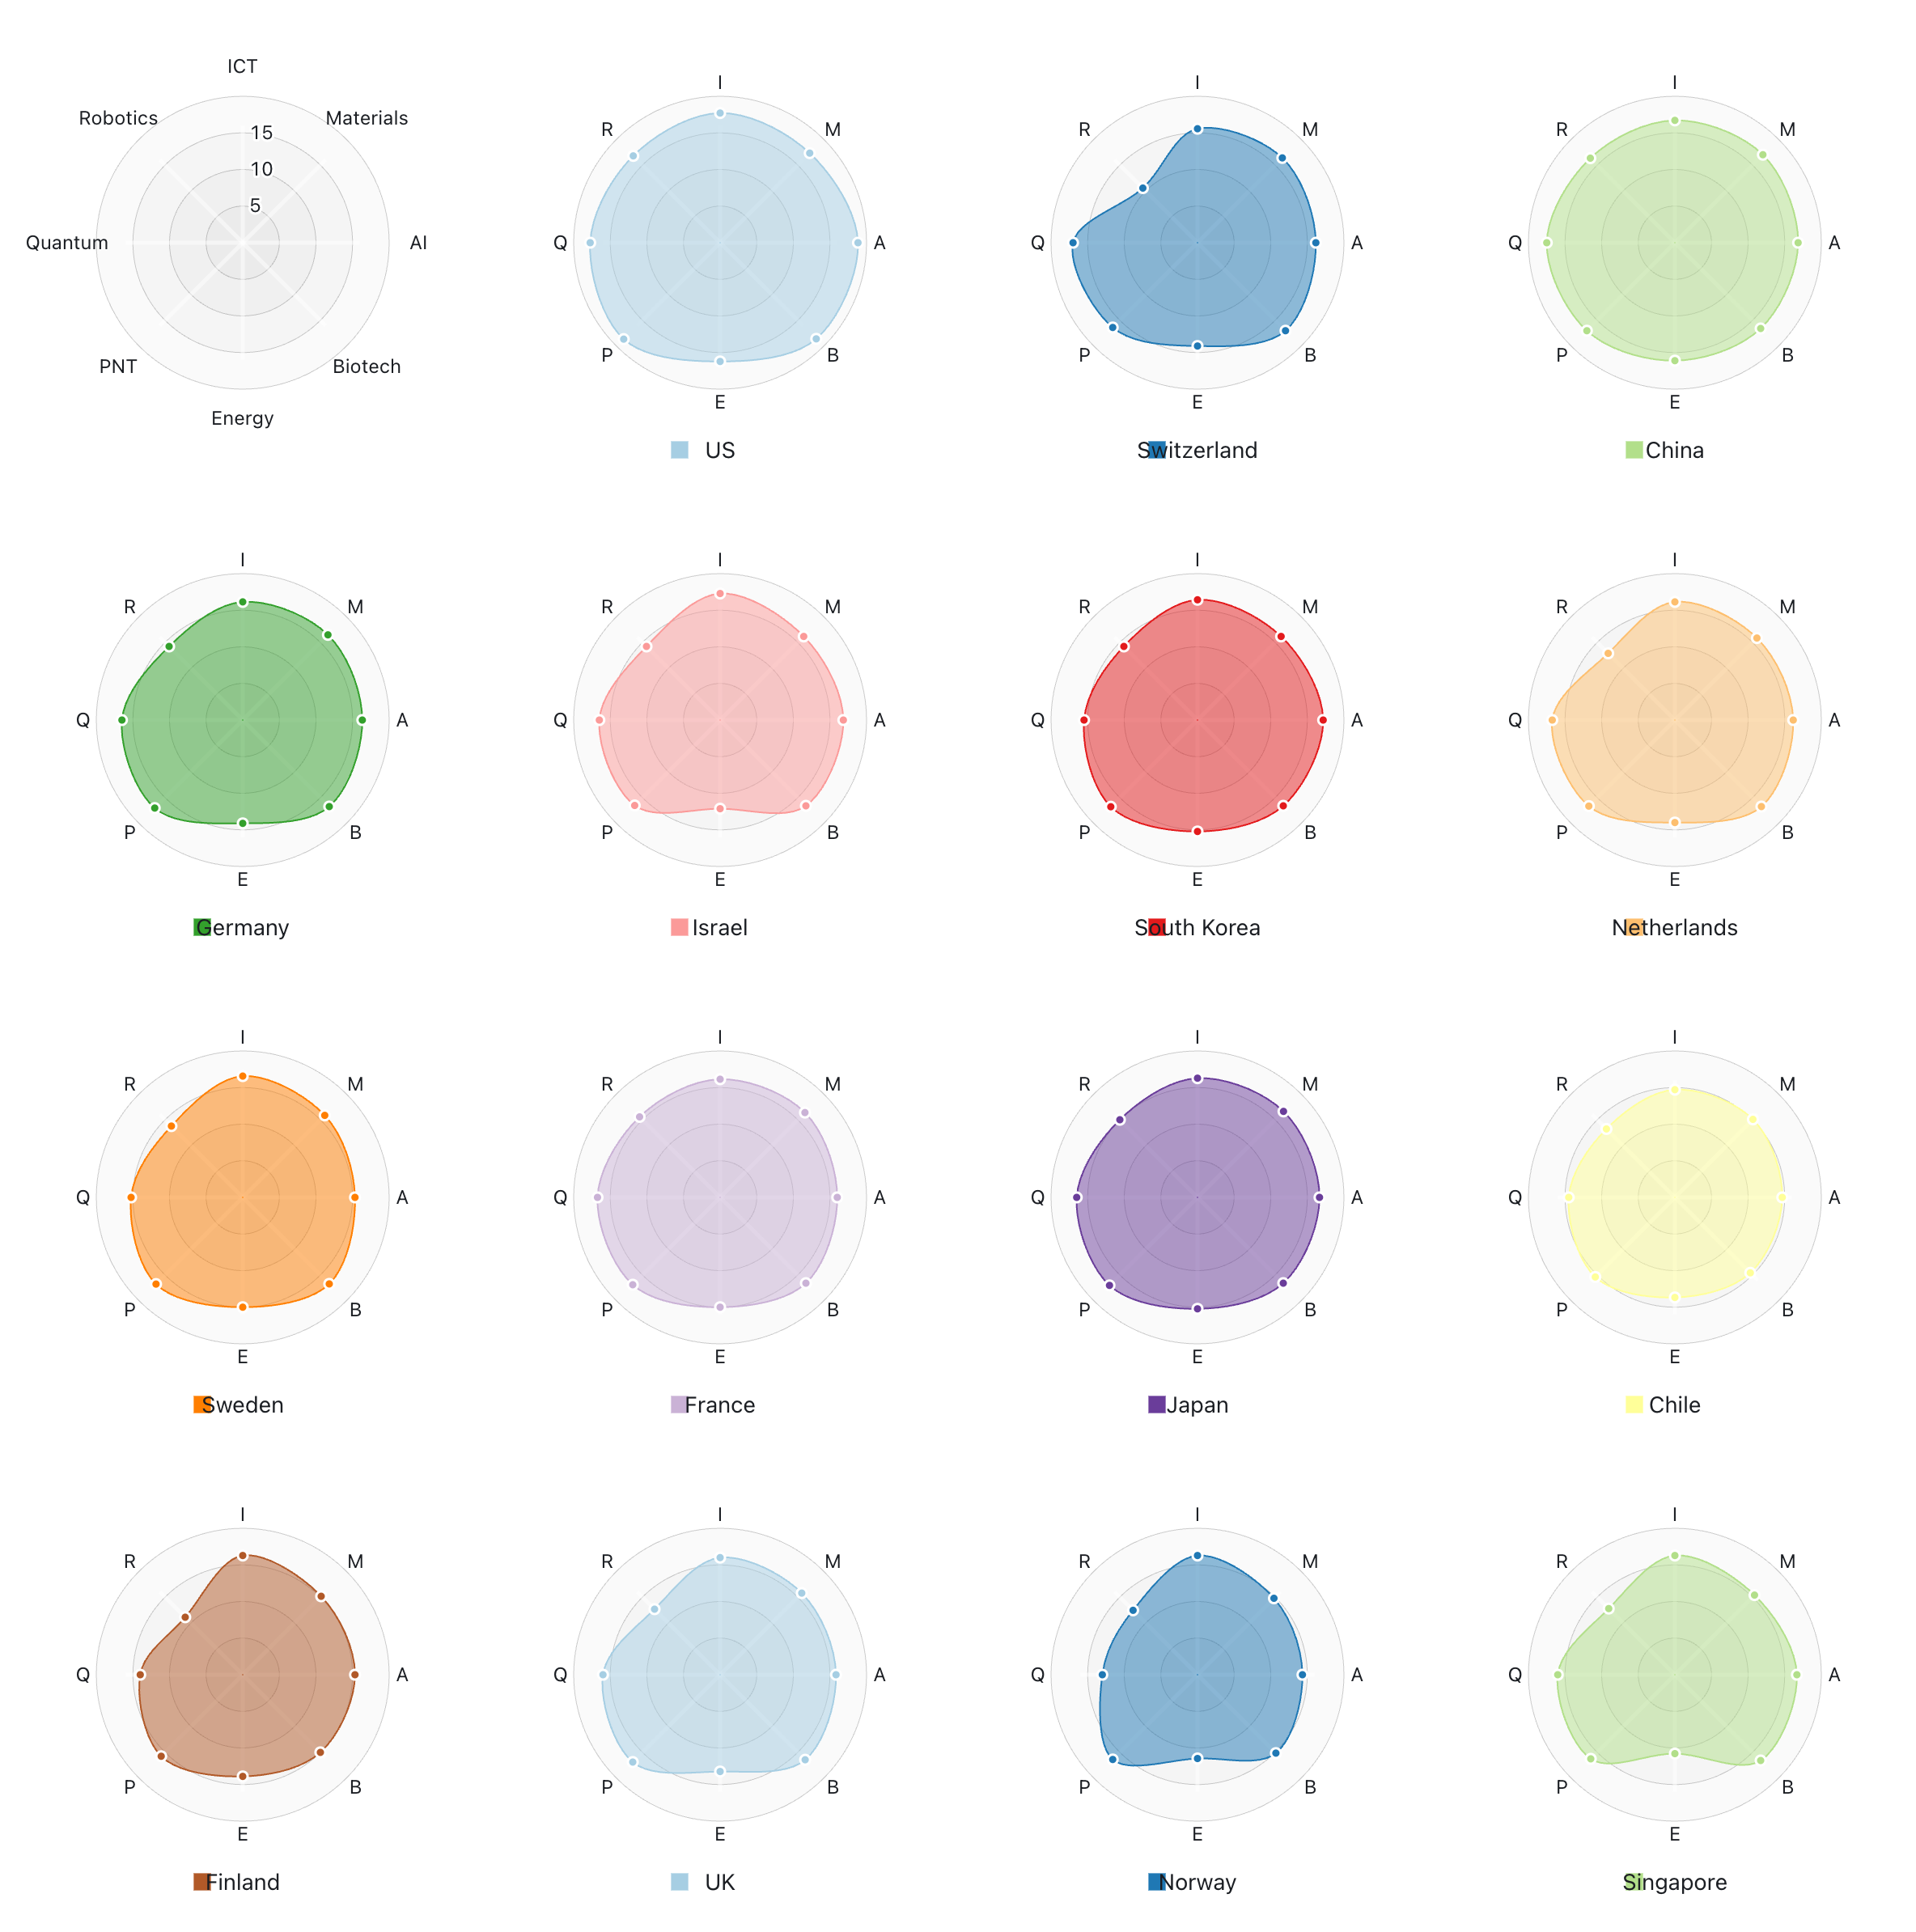
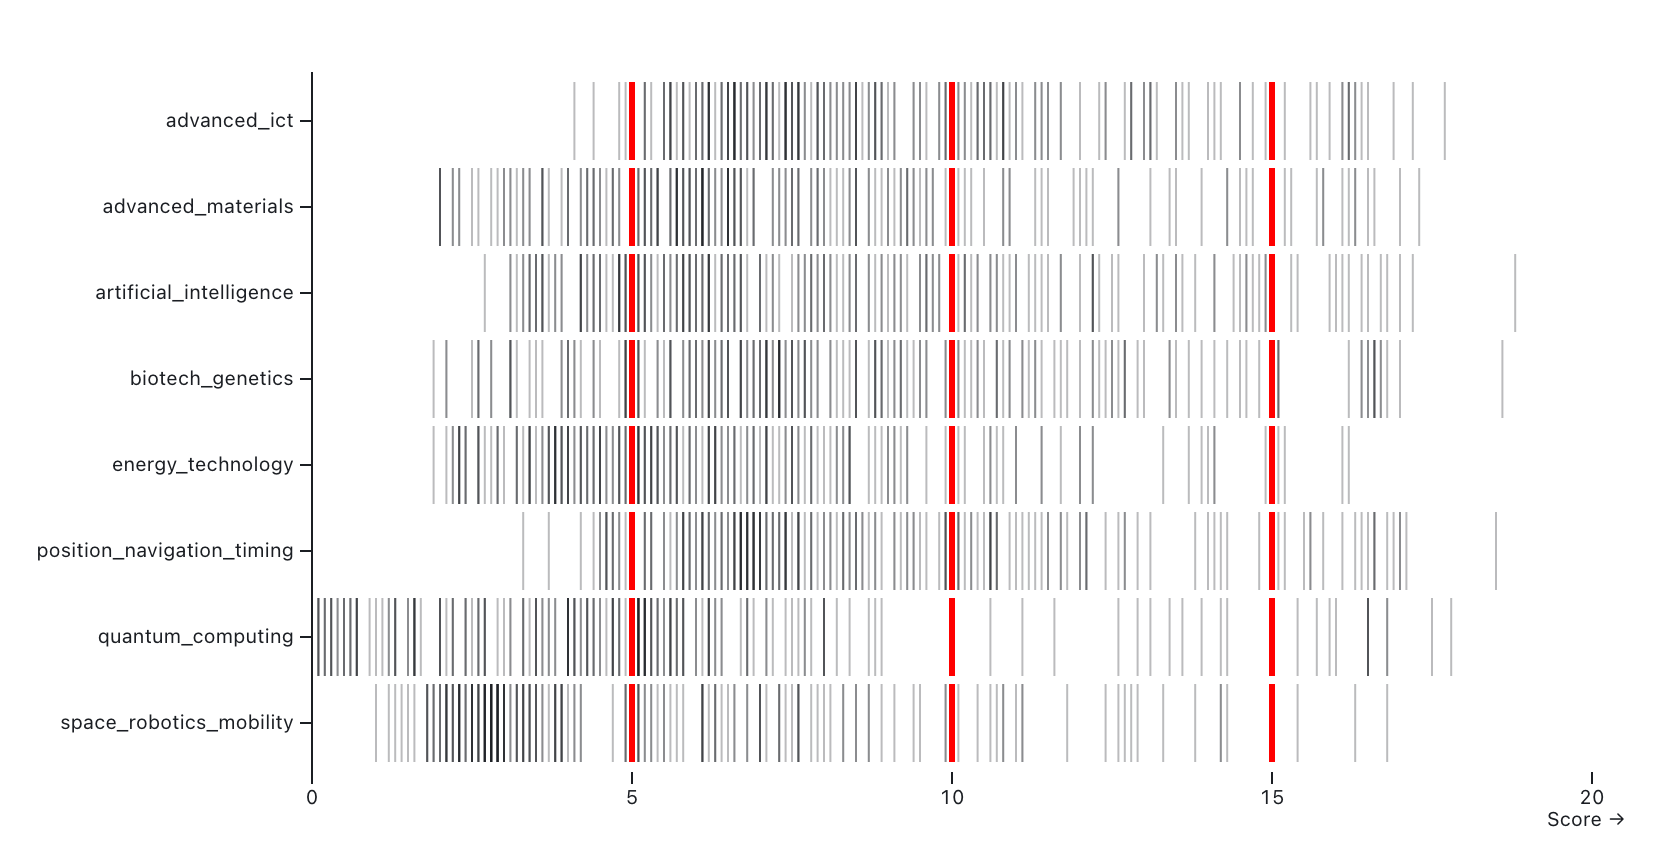
Figure X reveals notable capability gaps: Switzerland and Finland show significant weaknesses in Robotics, while many nations lag in Energy Technology. The US dominance in AI is visually striking. Figure X provides a broader view across all 200 assessed nations. Each vertical line represents one nation's capability group performance, with red lines marking the bottom quartile, median, and top quartile thresholds.
Figure 3. Global Capability Group Distribution
Advanced ICT
Figure X. Capability Table. Top 5 by Capability
| Capability | #1 | #2 | #3 | #4 | #5 |
|---|---|---|---|---|---|
| Advanced optical communication | 🇺🇸 US · 17.7 |
🇨🇳 CN · 17.3 |
🇯🇵 JP · 16.7 |
🇬🇧 GB · 16.6 |
🇩🇪 DE · 16.4 |
| Advanced radiofrequency communication | 🇺🇸 US · 18.3 |
🇨🇳 CN · 17.0 |
🇰🇷 KR · 16.6 |
🇯🇵 JP · 16.5 |
🇸🇪 SE · 16.4 |
| Advanced undersea wireless communication | 🇺🇸 US · 17.5 |
🇨🇳 CN · 16.8 |
🇬🇧 GB · 16.2 |
🇯🇵 JP · 16.0 |
🇫🇷 FR · 15.8 |
| Distributed ledgers | 🇺🇸 US · 18.9 |
🇨🇭 CH · 17.4 |
🇸🇬 SG · 17.2 |
🇬🇧 GB · 17.0 |
🇨🇳 CN · 16.8 |
| High performance computing | 🇺🇸 US · 19.2 |
🇨🇳 CN · 18.5 |
🇯🇵 JP · 17.3 |
🇩🇪 DE · 17.0 |
🇫🇷 FR · 16.8 |
| Mesh and infrastructure independent networks | 🇮🇱 IL · 18.1 |
🇺🇸 US · 17.9 |
🇨🇳 CN · 17.2 |
🇸🇪 SE · 16.8 |
🇰🇷 KR · 16.6 |
| Protective cyber security technologies | 🇮🇱 IL · 18.7 |
🇺🇸 US · 18.5 |
🇬🇧 GB · 17.3 |
🇨🇳 CN · 17.1 |
🇸🇪 SE · 16.9 |
Artificial Intelligence
Figure X. Capability Table. Top 5
National Case Studies
🇺🇸 United States
🇨🇳 China
🇮🇱 Israel
🇰🇷 South Korea
🇩🇪 Germany
Scenarios and Sensitivity Analysis
Pareto Sensitivity
Data and Definitions